OPEN-SOURCE SCRIPT
Moving Average of Volume for Up and Down Closes
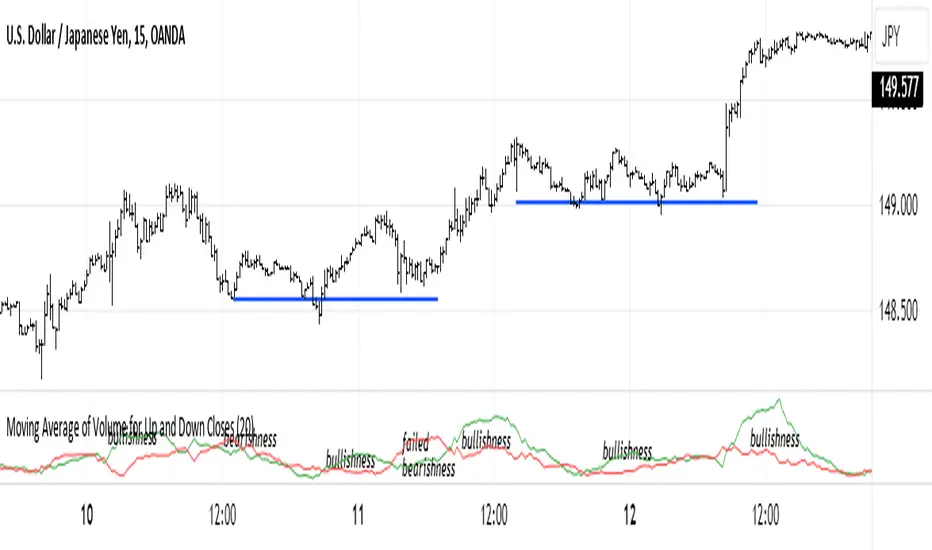
This indicator is intended to provide market bias information at a glance. Depending on the number of periods selected it can help identify changes in buying and selling sentiment or overall market bias. The two lines indicate increases and decreases in volumes for the selected number of periods. I recommend using this indicator with a minimum of clear support and resistance lines and a standard volume indicator. It does provided useful information as a stand-alone indicator. I don't use any indicators except volume, so this was meant to be my own personal volume analysis tool, however I feel that it can be very useful for other traders who may not have a deep understanding of volume analysis.
オープンソーススクリプト
TradingViewの精神に則り、このスクリプトの作者はコードをオープンソースとして公開してくれました。トレーダーが内容を確認・検証できるようにという配慮です。作者に拍手を送りましょう!無料で利用できますが、コードの再公開はハウスルールに従う必要があります。
免責事項
この情報および投稿は、TradingViewが提供または推奨する金融、投資、トレード、その他のアドバイスや推奨を意図するものではなく、それらを構成するものでもありません。詳細は利用規約をご覧ください。
オープンソーススクリプト
TradingViewの精神に則り、このスクリプトの作者はコードをオープンソースとして公開してくれました。トレーダーが内容を確認・検証できるようにという配慮です。作者に拍手を送りましょう!無料で利用できますが、コードの再公開はハウスルールに従う必要があります。
免責事項
この情報および投稿は、TradingViewが提供または推奨する金融、投資、トレード、その他のアドバイスや推奨を意図するものではなく、それらを構成するものでもありません。詳細は利用規約をご覧ください。