OPEN-SOURCE SCRIPT
Time Range

### Indicator Name: **Time Range**
#### Description:
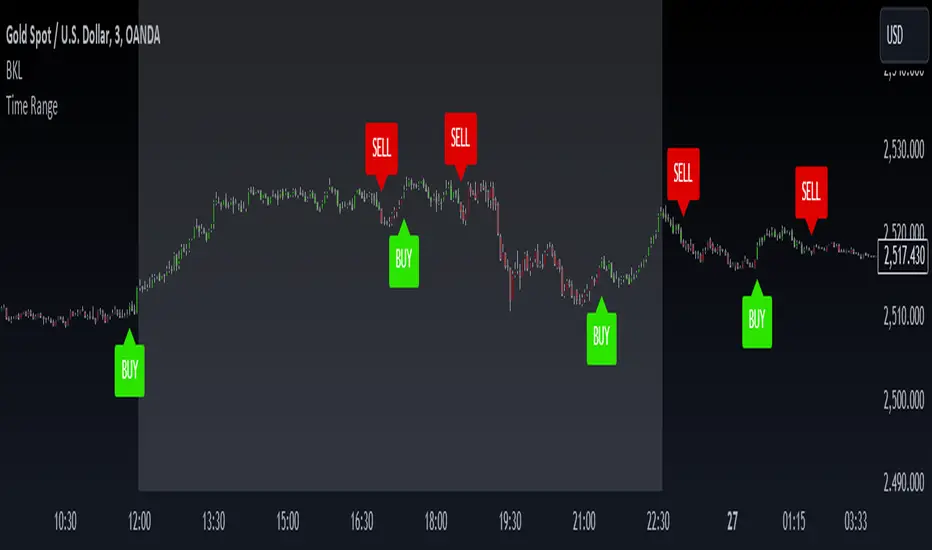
The **Time Range** indicator allows users to highlight specific time ranges on a chart for each day of the week. It uses customizable time inputs for every day (Monday to Sunday), allowing the user to define trading sessions or any time-based range. These sessions are visualized by shading the background of the chart within the defined periods.
#### Key Features:
- **Custom Sessions**: For each day of the week (Monday to Sunday), the user can define a unique time session by specifying the start time using the input fields.
- **Day-wise Session Activation**: The user can toggle the activation of sessions for each day by using checkboxes. If the session for a particular day is disabled, no background shading will appear for that day.
- **Background Highlighting**: When a session is active, the background of the chart during the specified session period will be shaded in gray with a 70% transparency. This helps the user visually identify active time ranges across multiple days.
#### Use Cases:
- **Highlighting Trading Sessions**: Traders can use this indicator to easily visualize specific market sessions such as the New York or London trading sessions.
- **Visualizing Custom Time Blocks**: Can be used to highlight any custom time blocks that are important for the trader, such as key trading hours, news release periods, or other time-based strategies.
#### Customizable Parameters:
- **Day Toggles**: Checkboxes to activate or deactivate sessions for each day of the week.
- **Time Range Inputs**: Time range inputs allow the user to set start times for each session, which are applied based on the user's selection for the day.
This indicator helps streamline chart analysis by giving clear visual markers for time-based events or trading windows.
オープンソーススクリプト
TradingViewの精神に則り、このスクリプトの作者はコードをオープンソースとして公開してくれました。トレーダーが内容を確認・検証できるようにという配慮です。作者に拍手を送りましょう!無料で利用できますが、コードの再公開はハウスルールに従う必要があります。
免責事項
この情報および投稿は、TradingViewが提供または推奨する金融、投資、トレード、その他のアドバイスや推奨を意図するものではなく、それらを構成するものでもありません。詳細は利用規約をご覧ください。
オープンソーススクリプト
TradingViewの精神に則り、このスクリプトの作者はコードをオープンソースとして公開してくれました。トレーダーが内容を確認・検証できるようにという配慮です。作者に拍手を送りましょう!無料で利用できますが、コードの再公開はハウスルールに従う必要があります。
免責事項
この情報および投稿は、TradingViewが提供または推奨する金融、投資、トレード、その他のアドバイスや推奨を意図するものではなく、それらを構成するものでもありません。詳細は利用規約をご覧ください。