INVITE-ONLY SCRIPT
更新済 OptimaLite
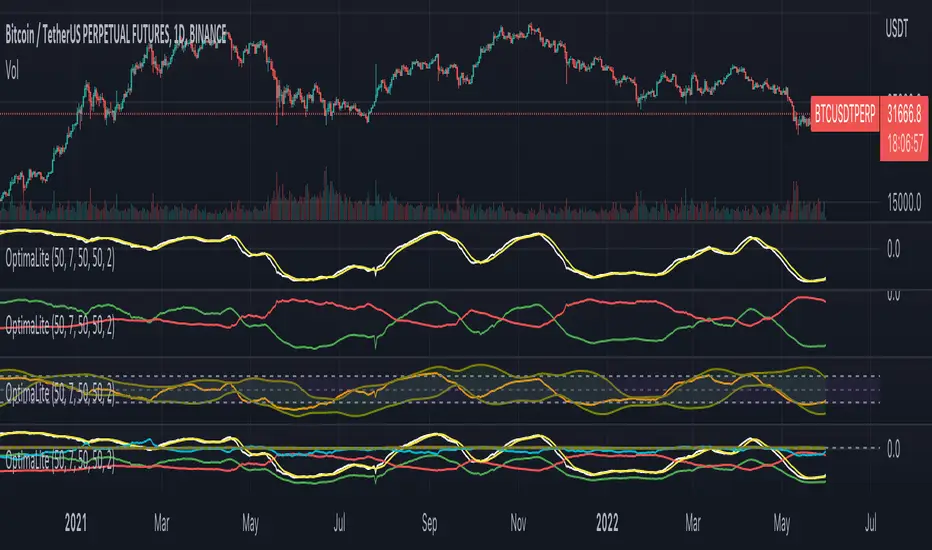
The OptimaLite algorithm performs the calculation of the integrated profits and losses for all the buyers and sellers that they have for the given “Calculation period” back in history for every time point. The idea is based on the principle of the accumulation and distribution of the capital among the market participants leading to the price trend change.
The indicator consists of the several components (signal lines):
1) “Return” – the main signal that reflects the integrated profits and losses delta (the “Return” moving average is added)
2) “Profit” and “Loss” – integrated profits and losses correspondingly
3) “Return Normalized” – the normalized “Return” for a given period of time
4) “Return High Frequency” – the “Return” signal compensated with the short-term fluctuations by RSI
How to use the indicator:
– Highs and lows of the indicator are associated with the overbought and oversold conditions points correspondingly.
– Crosses of the moving average with the main indicator line are associated with the trend change
– Divergencies between the indicator and price highs or lows can be used as signals for the trend reversal
– “Profit” and “Loss” signal lines intersections indicate the bulls/bears take over the market
Adjustments:
The periods of the calculation, averaging and normalization are the main parameters that could be tuned in order to optimize the indicator performance. Generally, the default values are sufficient for the nominal performance thought. But the best combination of those parameters is specific for each asset and timeframe, so it recommended to optimize them.
リリースノート
The unrelated drawing has been removed from the chart. リリースノート
Default input value for the averaging has been changed. リリースノート
The high frequency component correction has been made. 招待専用スクリプト
このスクリプトは作者が承認したユーザーのみアクセス可能です。使用するにはアクセス申請をして許可を得る必要があります。通常は支払い後に承認されます。詳細は下記の作者の指示に従うか、Crypto-Hamsterに直接お問い合わせください。
TradingViewは、作者を完全に信頼し、スクリプトの動作を理解していない限り、有料スクリプトの購入・使用を推奨しません。コミュニティスクリプトには無料のオープンソースの代替が多数あります。
作者の指示
To get the access to the indicator, send me a message on TradingView, Twitter or Telegram.
免責事項
この情報および投稿は、TradingViewが提供または推奨する金融、投資、トレード、その他のアドバイスや推奨を意図するものではなく、それらを構成するものでもありません。詳細は利用規約をご覧ください。
招待専用スクリプト
このスクリプトは作者が承認したユーザーのみアクセス可能です。使用するにはアクセス申請をして許可を得る必要があります。通常は支払い後に承認されます。詳細は下記の作者の指示に従うか、Crypto-Hamsterに直接お問い合わせください。
TradingViewは、作者を完全に信頼し、スクリプトの動作を理解していない限り、有料スクリプトの購入・使用を推奨しません。コミュニティスクリプトには無料のオープンソースの代替が多数あります。
作者の指示
To get the access to the indicator, send me a message on TradingView, Twitter or Telegram.
免責事項
この情報および投稿は、TradingViewが提供または推奨する金融、投資、トレード、その他のアドバイスや推奨を意図するものではなく、それらを構成するものでもありません。詳細は利用規約をご覧ください。