OPEN-SOURCE SCRIPT
Percent from And To All Time High,
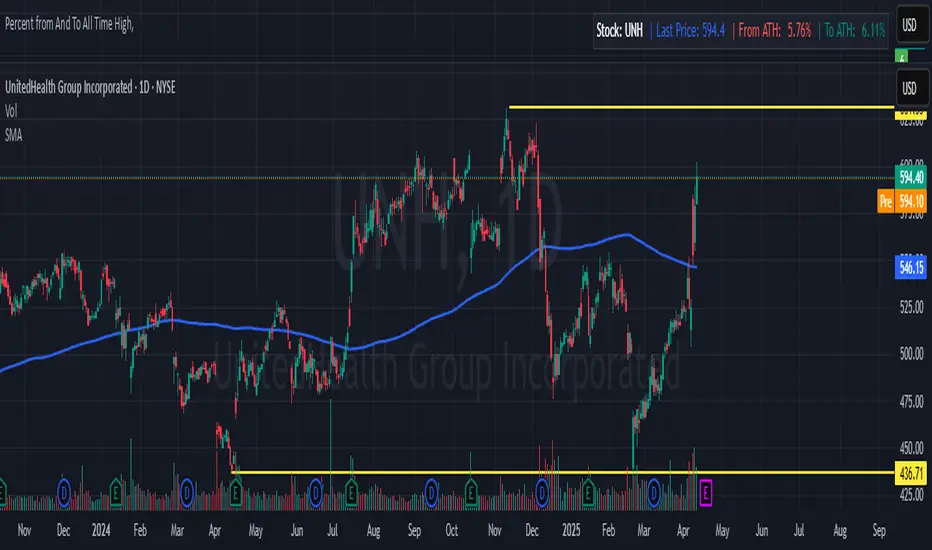
Indicator: Percent from All Time High - Raised Label
Overview:
This indicator shows the percentage difference between the current price of an asset and its all-time high (ATH). It displays these percentages in a raised label at the top of the chart. Additionally, the last price and the percentage difference to ATH are displayed in a table.
Features:
Displays the percentage difference from ATH (From ATH) and the percentage difference to ATH (To ATH) in a table.
The Last Price is shown along with the percentage difference.
The data is dynamically updated with the current price, and it will always show the latest information.
Visualizes price movements with colored bars to indicate price direction.
オープンソーススクリプト
TradingViewの精神に則り、このスクリプトの作者はコードをオープンソースとして公開してくれました。トレーダーが内容を確認・検証できるようにという配慮です。作者に拍手を送りましょう!無料で利用できますが、コードの再公開はハウスルールに従う必要があります。
免責事項
この情報および投稿は、TradingViewが提供または推奨する金融、投資、トレード、その他のアドバイスや推奨を意図するものではなく、それらを構成するものでもありません。詳細は利用規約をご覧ください。
オープンソーススクリプト
TradingViewの精神に則り、このスクリプトの作者はコードをオープンソースとして公開してくれました。トレーダーが内容を確認・検証できるようにという配慮です。作者に拍手を送りましょう!無料で利用できますが、コードの再公開はハウスルールに従う必要があります。
免責事項
この情報および投稿は、TradingViewが提供または推奨する金融、投資、トレード、その他のアドバイスや推奨を意図するものではなく、それらを構成するものでもありません。詳細は利用規約をご覧ください。