OPEN-SOURCE SCRIPT
RMA EMA Crossover | MisinkoMaster
The RMA EMA Crossover (REMAC) is a trend-following overlay indicator designed to detect shifts in market momentum using the interaction between a smoothed RMA (Relative Moving Average) and its EMA (Exponential Moving Average) counterpart.
This combination provides fast, adaptive signals while reducing noise, making it suitable for a wide range of markets and timeframes.
🔎 Methodology
RMA Calculation
The Relative Moving Average (RMA) is calculated over the user-defined length.
RMA is a type of smoothed moving average that reacts more gradually than a standard EMA, providing a stable baseline.
EMA of RMA
An Exponential Moving Average (EMA) is then applied to the RMA, creating a dual-layer moving average system.
This combination amplifies trend signals while reducing false crossovers.
Trend Detection (Crossover Logic)
Bullish Signal (Trend Up) → When RMA crosses above EMA.
Bearish Signal (Trend Down) → When EMA crosses above RMA.
This simple crossover system identifies the direction of momentum shifts efficiently.
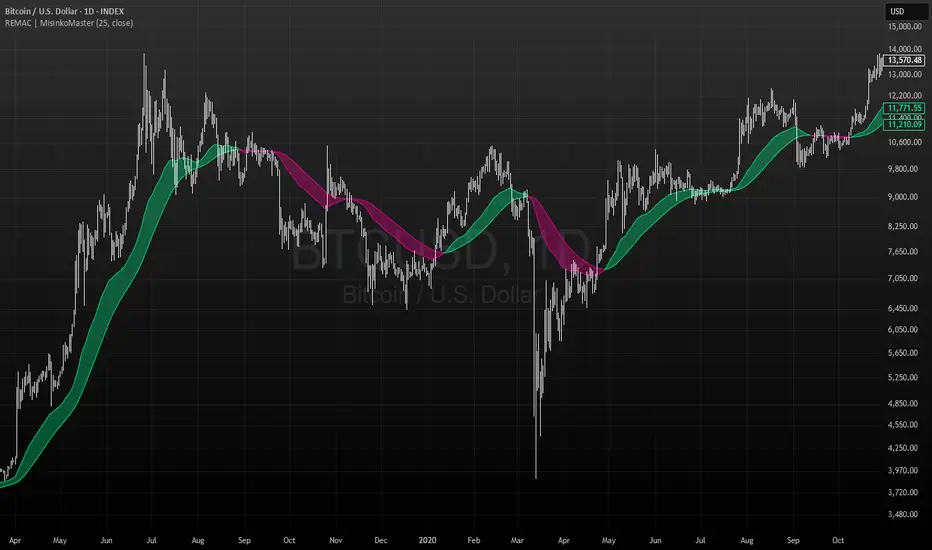
📈 Visualization
RMA and EMA are plotted directly on the chart.
Colors adapt dynamically to the current trend:
Cyan / Green hues → RMA above EMA (bullish momentum).
Magenta / Red hues → EMA above RMA (bearish momentum).
Filled areas between the two lines highlight zones of trend alignment or divergence, making it easier to spot reversals at a glance.
⚡ Features
Adjustable length parameter for RMA and EMA.
Overlay format allows for direct integration with price charts.
Visual trend scoring via color and fill for rapid assessment.
Works well across all asset classes: crypto, forex, stocks, indices.
✅ Use Cases
Trend Following → Stay on the right side of the market by following momentum shifts.
Reversal Detection → Crossovers highlight early trend changes.
Filter for Trading Systems → Use as a confirmation overlay for other indicators or strategies.
Visual Market Insight → Filled zones provide immediate context for trend strength.
This combination provides fast, adaptive signals while reducing noise, making it suitable for a wide range of markets and timeframes.
🔎 Methodology
RMA Calculation
The Relative Moving Average (RMA) is calculated over the user-defined length.
RMA is a type of smoothed moving average that reacts more gradually than a standard EMA, providing a stable baseline.
EMA of RMA
An Exponential Moving Average (EMA) is then applied to the RMA, creating a dual-layer moving average system.
This combination amplifies trend signals while reducing false crossovers.
Trend Detection (Crossover Logic)
Bullish Signal (Trend Up) → When RMA crosses above EMA.
Bearish Signal (Trend Down) → When EMA crosses above RMA.
This simple crossover system identifies the direction of momentum shifts efficiently.
📈 Visualization
RMA and EMA are plotted directly on the chart.
Colors adapt dynamically to the current trend:
Cyan / Green hues → RMA above EMA (bullish momentum).
Magenta / Red hues → EMA above RMA (bearish momentum).
Filled areas between the two lines highlight zones of trend alignment or divergence, making it easier to spot reversals at a glance.
⚡ Features
Adjustable length parameter for RMA and EMA.
Overlay format allows for direct integration with price charts.
Visual trend scoring via color and fill for rapid assessment.
Works well across all asset classes: crypto, forex, stocks, indices.
✅ Use Cases
Trend Following → Stay on the right side of the market by following momentum shifts.
Reversal Detection → Crossovers highlight early trend changes.
Filter for Trading Systems → Use as a confirmation overlay for other indicators or strategies.
Visual Market Insight → Filled zones provide immediate context for trend strength.
オープンソーススクリプト
TradingViewの精神に則り、このスクリプトの作者はコードをオープンソースとして公開してくれました。トレーダーが内容を確認・検証できるようにという配慮です。作者に拍手を送りましょう!無料で利用できますが、コードの再公開はハウスルールに従う必要があります。
"Better to take a step back, than to stand stuck forever."
免責事項
この情報および投稿は、TradingViewが提供または推奨する金融、投資、トレード、その他のアドバイスや推奨を意図するものではなく、それらを構成するものでもありません。詳細は利用規約をご覧ください。