OPEN-SOURCE SCRIPT
更新済 SLB | RSI 2W
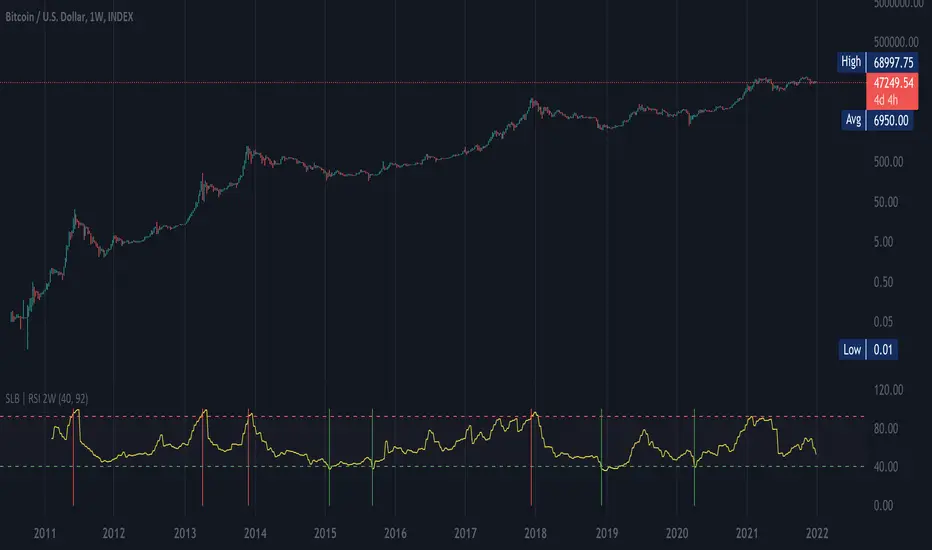
This script shows RSI ( Relative Strength Index ) over a 2 week period (RSI2W). The RSI2W is used by some traders to identify tops and valleys.
Taking historical BTC values as an example, the RSI 92+ (red lines) matches with the historical tops, and the RSI 40- (green lines) matches with the valleys, a good chance of bull markets' start.
Taking historical BTC values as an example, the RSI 92+ (red lines) matches with the historical tops, and the RSI 40- (green lines) matches with the valleys, a good chance of bull markets' start.
リリースノート
moving default max rsi value from 92 to 91オープンソーススクリプト
TradingViewの精神に則り、このスクリプトの作者はコードをオープンソースとして公開してくれました。トレーダーが内容を確認・検証できるようにという配慮です。作者に拍手を送りましょう!無料で利用できますが、コードの再公開はハウスルールに従う必要があります。
免責事項
この情報および投稿は、TradingViewが提供または推奨する金融、投資、トレード、その他のアドバイスや推奨を意図するものではなく、それらを構成するものでもありません。詳細は利用規約をご覧ください。
オープンソーススクリプト
TradingViewの精神に則り、このスクリプトの作者はコードをオープンソースとして公開してくれました。トレーダーが内容を確認・検証できるようにという配慮です。作者に拍手を送りましょう!無料で利用できますが、コードの再公開はハウスルールに従う必要があります。
免責事項
この情報および投稿は、TradingViewが提供または推奨する金融、投資、トレード、その他のアドバイスや推奨を意図するものではなく、それらを構成するものでもありません。詳細は利用規約をご覧ください。