OPEN-SOURCE SCRIPT
Mayer MA
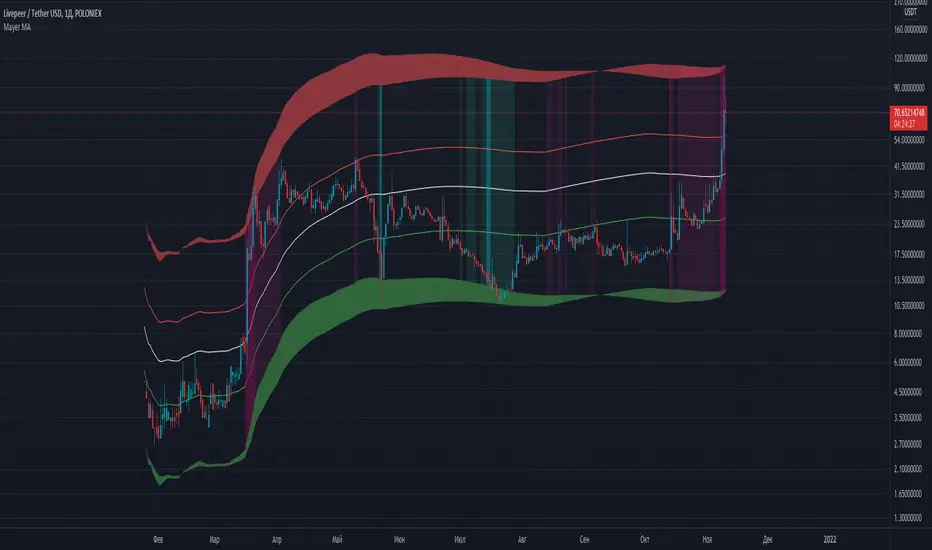
Mayer Multiple Price Bands Explained
The Mayer Multiple Price Bands chart is a simple modification to the original Mayer Multiple chart explained here.
Summary of Mayer Multiple
The Mayer Multiple is calculated by taking the price of Bitcoin and dividing it by the 200 day moving average value. The thinking behind the multiple is that by comparing the current price of bitcoin and its longer term moving average, you get a sense of if it is overbought (overvalued) or oversold (undervalued).
Adding Bands
The addition of price bands takes the multiple a step further by attempting to tell you how overbought or oversold bitcoin is with more detail. Instead of just three labels (overbought, fairly priced, and undervalued), you are given more granular labels: Oversold, Bearish, Bullish, Bullish Extension, and Overbought.
How to Calculate Mayer Multiple Bands
The Mayer multiple is calculated by taking the price of Bitcoin and dividing it by the 200 day moving average value. We take this a step further and display various prices that represent ‘bands’ of over and undervalued Bitcoin based on the multiple. They are as follows:
>2.5x: Overbought
>1.7x and <2.5x: Bullish Overextension
>1.1x and <1.7x Bullish Channel
>0.55x and <1.1x: Bearish Channel
<0.55x: Oversold
オープンソーススクリプト
TradingViewの精神に則り、このスクリプトの作者はコードをオープンソースとして公開してくれました。トレーダーが内容を確認・検証できるようにという配慮です。作者に拍手を送りましょう!無料で利用できますが、コードの再公開はハウスルールに従う必要があります。
免責事項
この情報および投稿は、TradingViewが提供または推奨する金融、投資、トレード、その他のアドバイスや推奨を意図するものではなく、それらを構成するものでもありません。詳細は利用規約をご覧ください。
オープンソーススクリプト
TradingViewの精神に則り、このスクリプトの作者はコードをオープンソースとして公開してくれました。トレーダーが内容を確認・検証できるようにという配慮です。作者に拍手を送りましょう!無料で利用できますが、コードの再公開はハウスルールに従う必要があります。
免責事項
この情報および投稿は、TradingViewが提供または推奨する金融、投資、トレード、その他のアドバイスや推奨を意図するものではなく、それらを構成するものでもありません。詳細は利用規約をご覧ください。