OPEN-SOURCE SCRIPT
更新済 Horizontal Lines from Current Price
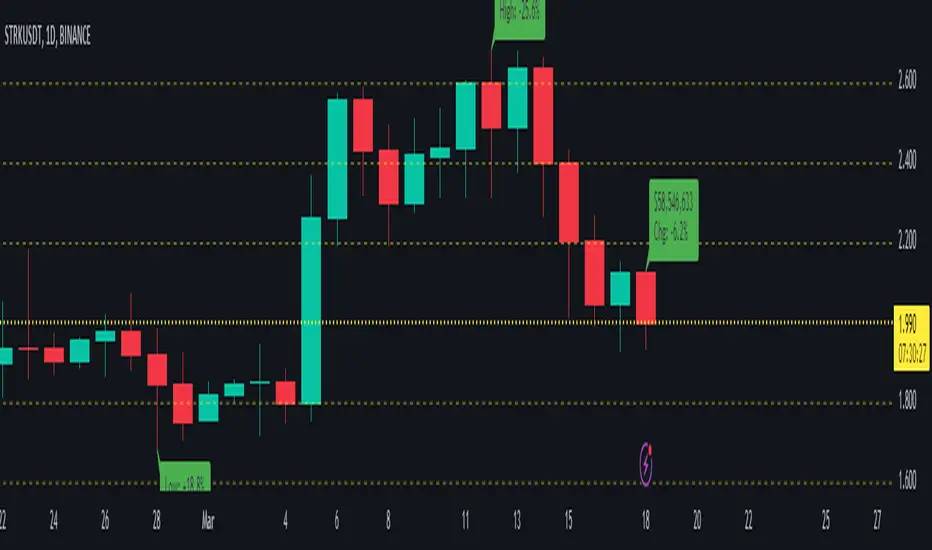
This indicator will help traders track price fluctuations in smaller time frames more conveniently than ever before.
Here's how it works:
Additionally, we also provide volume display (measured in USD) at the current candle position to assist traders in keeping track of market momentum more closely.
Installation guide for indicators:
Here's how it works:
Starting from the current price, the indicator will draw horizontal lines spaced 10% apart.
Now, whenever zooming in or out of the chart, traders can visually determine the level of price volatility more easily.
Additionally, we also provide volume display (measured in USD) at the current candle position to assist traders in keeping track of market momentum more closely.
Installation guide for indicators:
After installing the indicator, make sure that the indicator is merged with the price chart.
Secondly, ensure that the scale bar of the indicator merges with the scale bar of the price chart.
リリースノート
Update default inputsリリースノート
Clean source code & Inputsリリースノート
➕ Added the feature to view the highest and lowest price changes of the current bar compared to the previous bars.⚡⚡⚡リリースノート
Clean source code 🚧🚧🚧リリースノート
➕ Added the feature to view the changes in the current price bar.⚡⚡⚡リリースノート
Clean source code 🚧🚧🚧リリースノート
Update display current price 🚧🚧🚧リリースノート
Fix bug 🚧🚧🚧リリースノート
Fix bug 🚧🚧🚧リリースノート
Fix bug 🚧🚧🚧リリースノート
Fix bug 🚧🚧🚧リリースノート
Fix bug 🚧🚧🚧リリースノート
Fix bug 🚧🚧🚧リリースノート
Fix bug 🚧🚧🚧オープンソーススクリプト
TradingViewの精神に則り、このスクリプトの作者はコードをオープンソースとして公開してくれました。トレーダーが内容を確認・検証できるようにという配慮です。作者に拍手を送りましょう!無料で利用できますが、コードの再公開はハウスルールに従う必要があります。
免責事項
この情報および投稿は、TradingViewが提供または推奨する金融、投資、トレード、その他のアドバイスや推奨を意図するものではなく、それらを構成するものでもありません。詳細は利用規約をご覧ください。
オープンソーススクリプト
TradingViewの精神に則り、このスクリプトの作者はコードをオープンソースとして公開してくれました。トレーダーが内容を確認・検証できるようにという配慮です。作者に拍手を送りましょう!無料で利用できますが、コードの再公開はハウスルールに従う必要があります。
免責事項
この情報および投稿は、TradingViewが提供または推奨する金融、投資、トレード、その他のアドバイスや推奨を意図するものではなく、それらを構成するものでもありません。詳細は利用規約をご覧ください。