OPEN-SOURCE SCRIPT
Linear Regression Log Channel with 3 Standard Deviations, Alerts
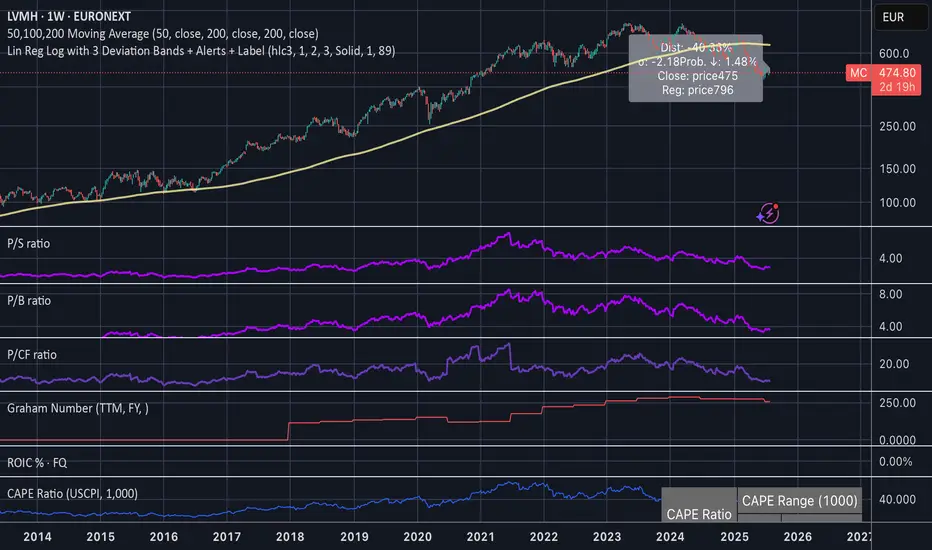
This indicator plots a logarithmic linear regression trendline starting from a user-defined date, along with ±1, ±2, and ±3 standard deviation bands. It is designed to help you visualize long-term price trends and statistically significant deviations.
Features:
• Log-scale linear regression line based on price since the selected start date
• Upper and lower bands at 1σ, 2σ, and 3σ, with the 3σ bands dashed for emphasis
• Optional filled channels between deviation bands
• Dynamic label showing:
• Distance from regression (in %)
• Distance in standard deviations (σ)
• Current price and regression value
• Estimated probability (assuming normal distribution) that the price continues moving further in its current direction
• Built-in alerts when price crosses the regression line or any of the deviation bands
This tool is useful for:
• Identifying mean-reversion setups or stretched trends
• Estimating likelihood of further directional movement
• Spotting statistically rare price conditions (e.g., >2σ or >3σ)
オープンソーススクリプト
TradingViewの精神に則り、このスクリプトの作者はコードをオープンソースとして公開してくれました。トレーダーが内容を確認・検証できるようにという配慮です。作者に拍手を送りましょう!無料で利用できますが、コードの再公開はハウスルールに従う必要があります。
免責事項
この情報および投稿は、TradingViewが提供または推奨する金融、投資、トレード、その他のアドバイスや推奨を意図するものではなく、それらを構成するものでもありません。詳細は利用規約をご覧ください。
オープンソーススクリプト
TradingViewの精神に則り、このスクリプトの作者はコードをオープンソースとして公開してくれました。トレーダーが内容を確認・検証できるようにという配慮です。作者に拍手を送りましょう!無料で利用できますが、コードの再公開はハウスルールに従う必要があります。
免責事項
この情報および投稿は、TradingViewが提供または推奨する金融、投資、トレード、その他のアドバイスや推奨を意図するものではなく、それらを構成するものでもありません。詳細は利用規約をご覧ください。