OPEN-SOURCE SCRIPT
Ultimate Trend Strength Meter Using TechnoBloom’s Indicators
Overview
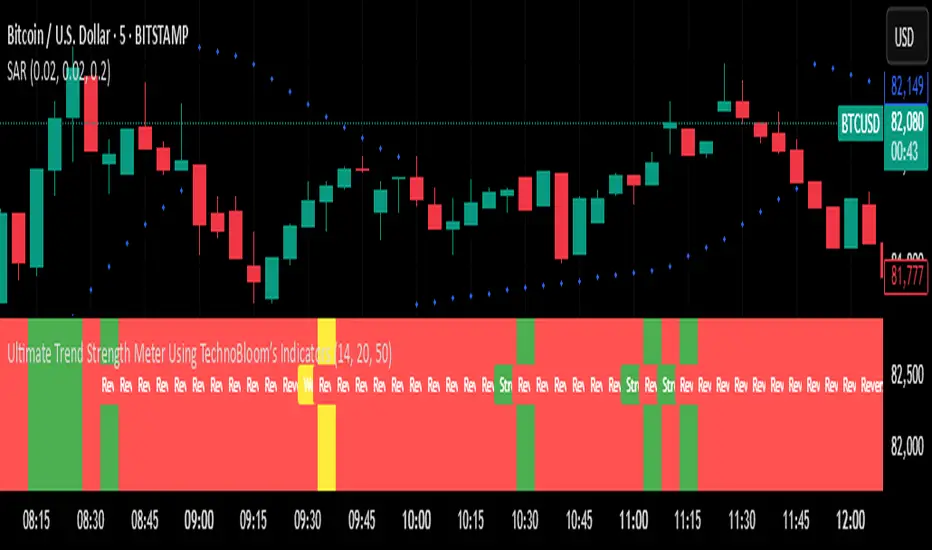
The Ultimate Trend Strength Meter Using TechnoBloom’s Indicators is a powerful trend analysis tool developed using TechnoBloom’s proprietary indicators. This indicator helps traders assess trend strength, momentum, and potential reversals by combining three essential market factors:
• Market Participation Ratio (MPR) – Measures trader engagement and volume strength.
• Volume Weighted Moving Average (VWMO) – Confirms momentum and trend direction.
• Fibonacci-Based Support & Resistance – Identifies key reversal zones and breakout points.
⸻
Key Features:
✅ Color-Coded Trend Strength Meter:
• 🟢 Green – Strong Trend (High Confidence): High participation, strong momentum, and no major resistance.
• 🟡 Yellow – Weak Trend (Caution): Moderate participation, possible resistance ahead, and trend uncertainty.
• 🔴 Red – Reversal Risk / No Trend: Low market engagement, momentum uncertainty, and proximity to major Fibonacci levels.
✅ Eliminates False Signals & Weak Trends:
• Prevents choppy market entries by ensuring high-volume confirmation.
• Ideal for filtering fake breakouts and exhaustion phases.
✅ Works for All Trading Styles & Markets:
• Scalping (1m-5m), Day Trading (15m-1H), and Swing Trading (4H-Daily).
• Suitable for Forex, Stocks, Crypto, Indices, and Commodities (XAUUSD, US30, BTCUSD, etc.).
✅ Customizable for Any Strategy:
• Adjustable MPR thresholds, VWMO smoothing, and Fibonacci sensitivity.
• Built-in alerts notify traders when trend conditions change.
⸻
How to Use It:
1️⃣ Enter trades when the meter turns Green (Strong Trend) and aligns with your strategy.
2️⃣ Avoid or exit trades when it turns Red (Reversal Risk) to prevent unnecessary losses.
3️⃣ Use Yellow as a caution zone – wait for confirmation before making a move.
4️⃣ Combine with breakout strategies or support/resistance setups for high-probability entries.
⸻
About TechnoBlooms
TechnoBlooms is committed to developing high-precision trading indicators that enhance decision-making for traders across all markets. This tool is a result of our in-depth market research and algorithmic advancements to provide traders with an edge.
🚀 Upgrade your trading with the Ultimate Trend Strength Meter – Developed by TechnoBlooms! 🚀
オープンソーススクリプト
TradingViewの精神に則り、このスクリプトの作者はコードをオープンソースとして公開してくれました。トレーダーが内容を確認・検証できるようにという配慮です。作者に拍手を送りましょう!無料で利用できますが、コードの再公開はハウスルールに従う必要があります。
免責事項
この情報および投稿は、TradingViewが提供または推奨する金融、投資、トレード、その他のアドバイスや推奨を意図するものではなく、それらを構成するものでもありません。詳細は利用規約をご覧ください。
オープンソーススクリプト
TradingViewの精神に則り、このスクリプトの作者はコードをオープンソースとして公開してくれました。トレーダーが内容を確認・検証できるようにという配慮です。作者に拍手を送りましょう!無料で利用できますが、コードの再公開はハウスルールに従う必要があります。
免責事項
この情報および投稿は、TradingViewが提供または推奨する金融、投資、トレード、その他のアドバイスや推奨を意図するものではなく、それらを構成するものでもありません。詳細は利用規約をご覧ください。