OPEN-SOURCE SCRIPT
Time Cycles Indicator
アップデート済
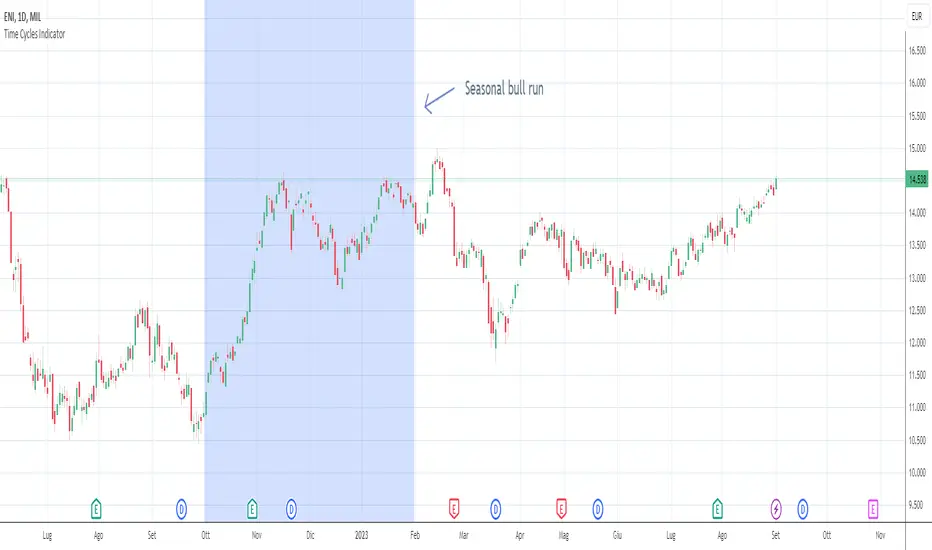
This script is used to analyze the seasonality of any asset (commodities, stocks, indices).
To use the script select a timeframe D or W and select the months you are interested in the script settings. You will see all the candles that are part of those months highlighted in the chart.
You can use this script to understand if assets have a cyclical behavior in certain months of the year.
To use the script select a timeframe D or W and select the months you are interested in the script settings. You will see all the candles that are part of those months highlighted in the chart.
You can use this script to understand if assets have a cyclical behavior in certain months of the year.
リリースノート
Set winter period as defaultリリースノート
Set winter period as default. Updated the image of the indicatorオープンソーススクリプト
TradingViewの精神に則り、このスクリプトの作者は、トレーダーが理解し検証できるようにオープンソースで公開しています。作者に敬意を表します!無料で使用することができますが、このコードを投稿で再利用するには、ハウスルールに準拠する必要があります。 お気に入りに登録してチャート上でご利用頂けます。
免責事項
これらの情報および投稿は、TradingViewが提供または保証する金融、投資、取引、またはその他の種類のアドバイスや推奨を意図したものではなく、またそのようなものでもありません。詳しくは利用規約をご覧ください。