OPEN-SOURCE SCRIPT
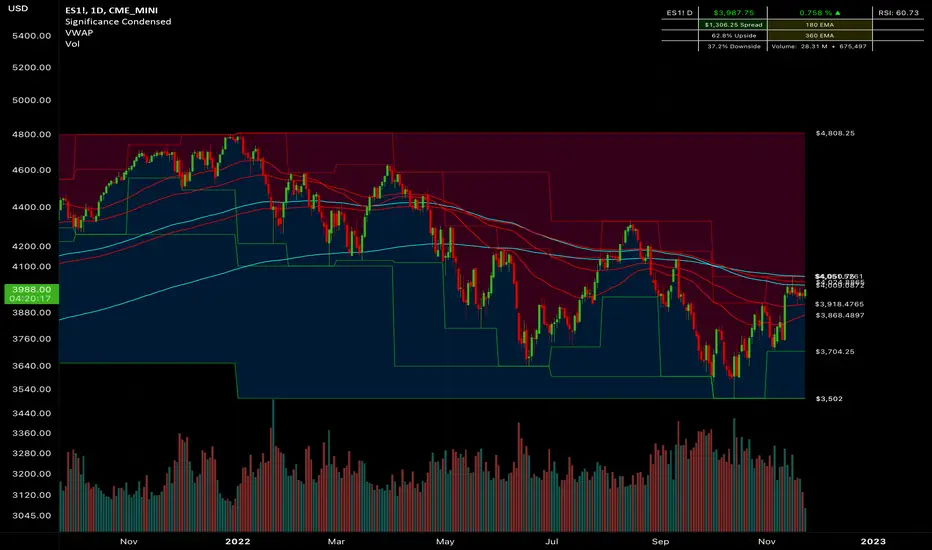
更新済 Significance Condensed

// Indicator Name: "Significance Condensed"
// This is a "Multi-Indicator", which includes:
// Custom Candlesticks with Bearish/Bullish Engulfing Body Fills, otherwise hollow.
// 3 EMA's with user inputs + 2 Static EMA's
// Continuous plots of high/low values with up to 3 overlapping timeframes.
// Table: Contains the TICKER.ID, Current Price, Percent On Day (note that it does not work for extended hours charts well), Current Timeframe RSI Value(Adjustable), Spread(Difference from the Current Price to High value, 2 Static EMA displays, Upside/Downside(Percentile from Current Price to High/Low Range, respectively, and Volume(Daily Volume + Current Bar Volume)
//CANDLESTICK DISCLAIMER
// If you would like to use the custom candlestick plots, (hollow, else engulfing), that come along with this indicator,
// be sure to disable the Candlestick Body, Wick, and Border under Chart Appearance; and then enable "Candlesticks Active" in the indicator settings.
//Final Product. Finito. Done.
リリースノート
Added a tooltip to the Timeframe that is coordinated to the Spread Math on the table.Corrected a mis-titled User Ema
Corrected Timeframe Logic Flow for Ease of Understanding.
Changed some Default Colors.
Mr. Storm
Enjoy!
オープンソーススクリプト
TradingViewの精神に則り、このスクリプトの作者はコードをオープンソースとして公開してくれました。トレーダーが内容を確認・検証できるようにという配慮です。作者に拍手を送りましょう!無料で利用できますが、コードの再公開はハウスルールに従う必要があります。
免責事項
この情報および投稿は、TradingViewが提供または推奨する金融、投資、トレード、その他のアドバイスや推奨を意図するものではなく、それらを構成するものでもありません。詳細は利用規約をご覧ください。
オープンソーススクリプト
TradingViewの精神に則り、このスクリプトの作者はコードをオープンソースとして公開してくれました。トレーダーが内容を確認・検証できるようにという配慮です。作者に拍手を送りましょう!無料で利用できますが、コードの再公開はハウスルールに従う必要があります。
免責事項
この情報および投稿は、TradingViewが提供または推奨する金融、投資、トレード、その他のアドバイスや推奨を意図するものではなく、それらを構成するものでもありません。詳細は利用規約をご覧ください。