OPEN-SOURCE SCRIPT
更新済 Bollinger Bands %B + RSI
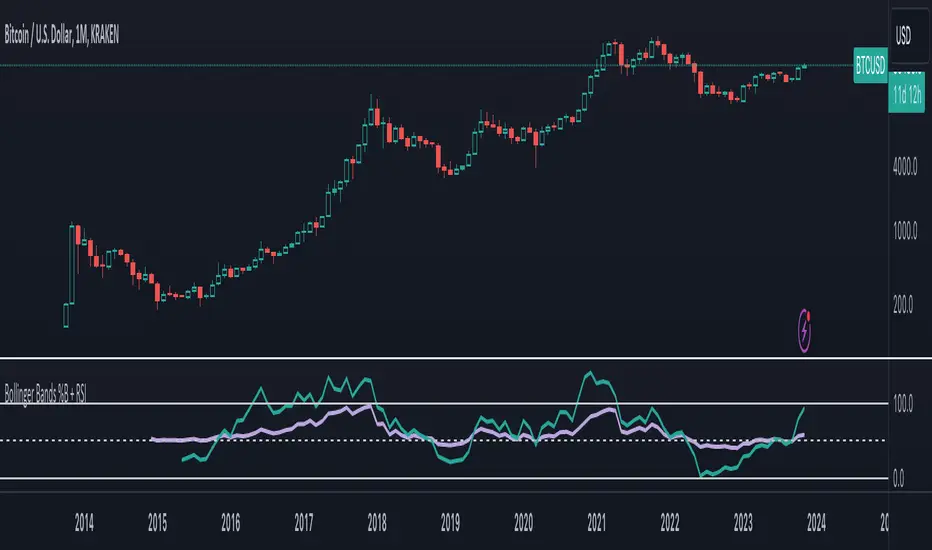
Bollinger Bands %b and RSI in one, and a experimental RSI cloud based in BB formula.
RSI scale goes from 0.00-1.00 instead of 0 -100.
RSI scale goes from 0.00-1.00 instead of 0 -100.
リリースノート
Changes settings to default values of original (RSi 14 periods and bb%b 20 periods).Added a subtile color change on bb%b when Stochastic do crossovers.
Changed values from 0-1 to 0-100, where bb%b over 100 is outside upper band and under 0 is outside lower band.
リリースノート
Fixed z-index on plots.Added stochastic color changes to rsi.
リリースノート
And now Hull MA crossover indications on bb%b (the teal line).The RSI show stochastic crossover (the purple line).
Strong color indicates upwards trend.
Pale color indicates downwards trend.
リリースノート
This is to abstract, so moving onwards with these two indicators:

Will update if i find a good way to merge them again.
リリースノート
Added Hull.リリースノート
Updated script to Pinescript version 5.オープンソーススクリプト
TradingViewの精神に則り、このスクリプトの作者はコードをオープンソースとして公開してくれました。トレーダーが内容を確認・検証できるようにという配慮です。作者に拍手を送りましょう!無料で利用できますが、コードの再公開はハウスルールに従う必要があります。
免責事項
この情報および投稿は、TradingViewが提供または推奨する金融、投資、トレード、その他のアドバイスや推奨を意図するものではなく、それらを構成するものでもありません。詳細は利用規約をご覧ください。
オープンソーススクリプト
TradingViewの精神に則り、このスクリプトの作者はコードをオープンソースとして公開してくれました。トレーダーが内容を確認・検証できるようにという配慮です。作者に拍手を送りましょう!無料で利用できますが、コードの再公開はハウスルールに従う必要があります。
免責事項
この情報および投稿は、TradingViewが提供または推奨する金融、投資、トレード、その他のアドバイスや推奨を意図するものではなく、それらを構成するものでもありません。詳細は利用規約をご覧ください。