OPEN-SOURCE SCRIPT
更新済 Candle Sequence
Looking to easily identify moments of strong market conviction? "Racha Velas" (or your chosen English name like "Consecutive Candles Streak") allows you to visualize clearly and directly sequences of consecutive bullish and bearish candles.
**Key Features:**
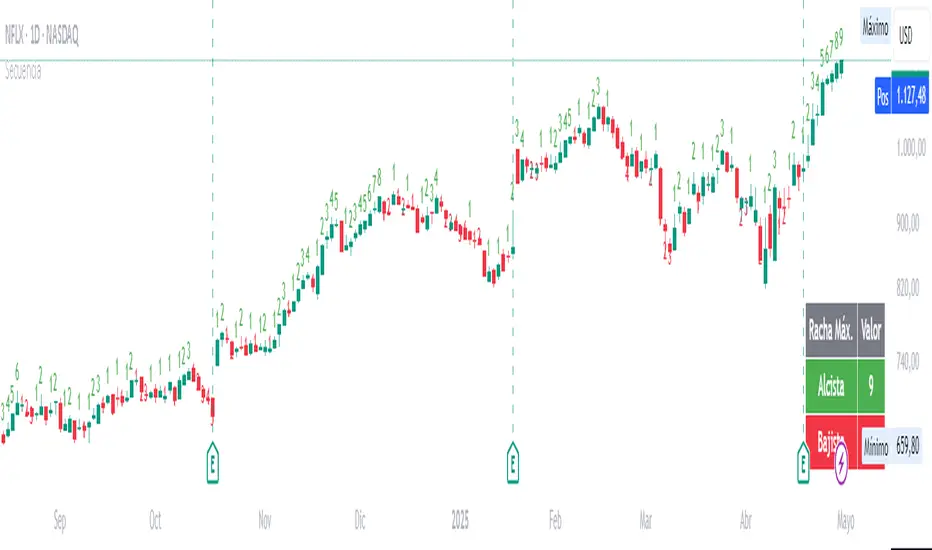
* **Real-time Counting:** Displays the number of consecutive candles directly on the chart.
* **Visual Customization:** Adjust the text size and color for optimal visualization.
* **Vertical Offset:** Control the position of the counter to avoid obstructions.
* **Maximum Streaks Table (Optional):** Visualize the largest bullish and bearish streaks found in the chart's history, useful for understanding volatility and price behavior.
* **Easy to Use:** Simply add the indicator to your chart and start analyzing.
This indicator is a valuable tool for traders looking to confirm trends, identify potential exhaustion points, or simply understand price dynamics at a glance. Give it a try and discover the market's streaks!
*****************************************************************************************************
¿Buscas identificar momentos de fuerte convicción del mercado? "Racha Velas" te permite visualizar de forma clara y directa las secuencias de velas consecutivas alcistas y bajistas.
**Características principales:**
* **Conteo en Tiempo Real:** Muestra el número de velas consecutivas directamente en el gráfico.
* **Personalización Visual:** Ajusta el tamaño y color del texto para una visualización óptima.
* **Offset Vertical:** Controla la posición del contador para evitar obstrucciones.
* **Tabla de Rachas Máximas (Opcional):** Visualiza las mayores rachas alcistas y bajistas encontradas en el historial del gráfico, útil para entender la volatilidad y el comportamiento del precio.
* **Fácil de Usar:** Simplemente añade el indicador a tu gráfico y comienza a analizar.
Este indicador es una herramienta valiosa para traders que buscan confirmar tendencias, identificar posibles agotamientos o simplemente entender la dinámica del precio en un vistazo. ¡Pruébalo y descubre las rachas del mercado!
**Key Features:**
* **Real-time Counting:** Displays the number of consecutive candles directly on the chart.
* **Visual Customization:** Adjust the text size and color for optimal visualization.
* **Vertical Offset:** Control the position of the counter to avoid obstructions.
* **Maximum Streaks Table (Optional):** Visualize the largest bullish and bearish streaks found in the chart's history, useful for understanding volatility and price behavior.
* **Easy to Use:** Simply add the indicator to your chart and start analyzing.
This indicator is a valuable tool for traders looking to confirm trends, identify potential exhaustion points, or simply understand price dynamics at a glance. Give it a try and discover the market's streaks!
*****************************************************************************************************
¿Buscas identificar momentos de fuerte convicción del mercado? "Racha Velas" te permite visualizar de forma clara y directa las secuencias de velas consecutivas alcistas y bajistas.
**Características principales:**
* **Conteo en Tiempo Real:** Muestra el número de velas consecutivas directamente en el gráfico.
* **Personalización Visual:** Ajusta el tamaño y color del texto para una visualización óptima.
* **Offset Vertical:** Controla la posición del contador para evitar obstrucciones.
* **Tabla de Rachas Máximas (Opcional):** Visualiza las mayores rachas alcistas y bajistas encontradas en el historial del gráfico, útil para entender la volatilidad y el comportamiento del precio.
* **Fácil de Usar:** Simplemente añade el indicador a tu gráfico y comienza a analizar.
Este indicador es una herramienta valiosa para traders que buscan confirmar tendencias, identificar posibles agotamientos o simplemente entender la dinámica del precio en un vistazo. ¡Pruébalo y descubre las rachas del mercado!
リリースノート
Looking to easily identify moments of strong market conviction? "Racha Velas" (or your chosen English name like "Consecutive Candles Streak") allows you to visualize clearly and directly sequences of consecutive bullish and bearish candles.**Key Features:**
* **Real-time Counting:** Displays the number of consecutive candles directly on the chart.
* **Visual Customization:** Adjust the text size and color for optimal visualization.
* **Vertical Offset:** Control the position of the counter to avoid obstructions.
* **Maximum Streaks Table (Optional):** Visualize the largest bullish and bearish streaks found in the chart's history, useful for understanding volatility and price behavior.
* **Easy to Use:** Simply add the indicator to your chart and start analyzing.
This indicator is a valuable tool for traders looking to confirm trends, identify potential exhaustion points, or simply understand price dynamics at a glance. Give it a try and discover the market's streaks!
リリースノート
Looking to easily identify moments of strong market conviction? Candle Sequence allows you to visualize clearly and directly sequences of consecutive bullish and bearish candles.**Key Features:**
* **Real-time Counting:** Displays the number of consecutive candles directly on the chart.
* **Visual Customization:** Adjust the text size and color for optimal visualization.
* **Vertical Offset:** Control the position of the counter to avoid obstructions.
* **Maximum Streaks Table (Optional):** Visualize the largest bullish and bearish streaks found in the chart's history, useful for understanding volatility and price behavior.
* **Easy to Use:** Simply add the indicator to your chart and start analyzing.
This indicator is a valuable tool for traders looking to confirm trends, identify potential exhaustion points, or simply understand price dynamics at a glance. Give it a try and discover the market's streaks!
リリースノート
.オープンソーススクリプト
TradingViewの精神に則り、このスクリプトの作者はコードをオープンソースとして公開してくれました。トレーダーが内容を確認・検証できるようにという配慮です。作者に拍手を送りましょう!無料で利用できますが、コードの再公開はハウスルールに従う必要があります。
免責事項
この情報および投稿は、TradingViewが提供または推奨する金融、投資、トレード、その他のアドバイスや推奨を意図するものではなく、それらを構成するものでもありません。詳細は利用規約をご覧ください。
オープンソーススクリプト
TradingViewの精神に則り、このスクリプトの作者はコードをオープンソースとして公開してくれました。トレーダーが内容を確認・検証できるようにという配慮です。作者に拍手を送りましょう!無料で利用できますが、コードの再公開はハウスルールに従う必要があります。
免責事項
この情報および投稿は、TradingViewが提供または推奨する金融、投資、トレード、その他のアドバイスや推奨を意図するものではなく、それらを構成するものでもありません。詳細は利用規約をご覧ください。