OPEN-SOURCE SCRIPT
Golden Ratio Multiplier (x1.6; x2; x3)
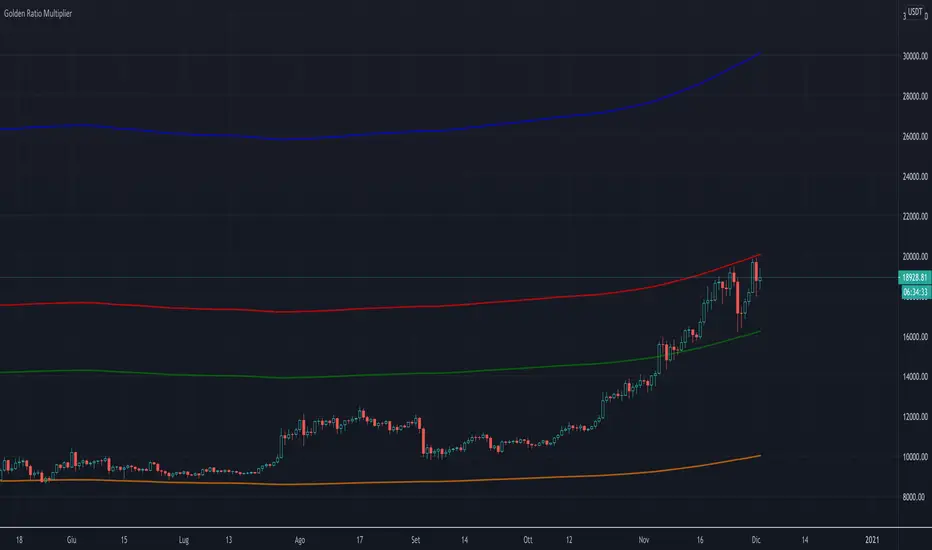
The script displays three multipliers (x1.618; x2; x3) of the Golden Ratio (starting with MA at 350 days) to identify the following levels of support:
Note: the orange line is the SMA at 350 days.
- the multiplier x1.618 is an accumulation high (green line)
- the multiplier x2 is a support that identify a low bull high (red line)
- the multiplier x3 is a support that identify an upper bull high (blu line)
Note: the orange line is the SMA at 350 days.
オープンソーススクリプト
TradingViewの精神に則り、このスクリプトの作者はコードをオープンソースとして公開してくれました。トレーダーが内容を確認・検証できるようにという配慮です。作者に拍手を送りましょう!無料で利用できますが、コードの再公開はハウスルールに従う必要があります。
免責事項
この情報および投稿は、TradingViewが提供または推奨する金融、投資、トレード、その他のアドバイスや推奨を意図するものではなく、それらを構成するものでもありません。詳細は利用規約をご覧ください。
オープンソーススクリプト
TradingViewの精神に則り、このスクリプトの作者はコードをオープンソースとして公開してくれました。トレーダーが内容を確認・検証できるようにという配慮です。作者に拍手を送りましょう!無料で利用できますが、コードの再公開はハウスルールに従う必要があります。
免責事項
この情報および投稿は、TradingViewが提供または推奨する金融、投資、トレード、その他のアドバイスや推奨を意図するものではなく、それらを構成するものでもありません。詳細は利用規約をご覧ください。