OPEN-SOURCE SCRIPT
更新済 Correlations P/L Range (in percent)
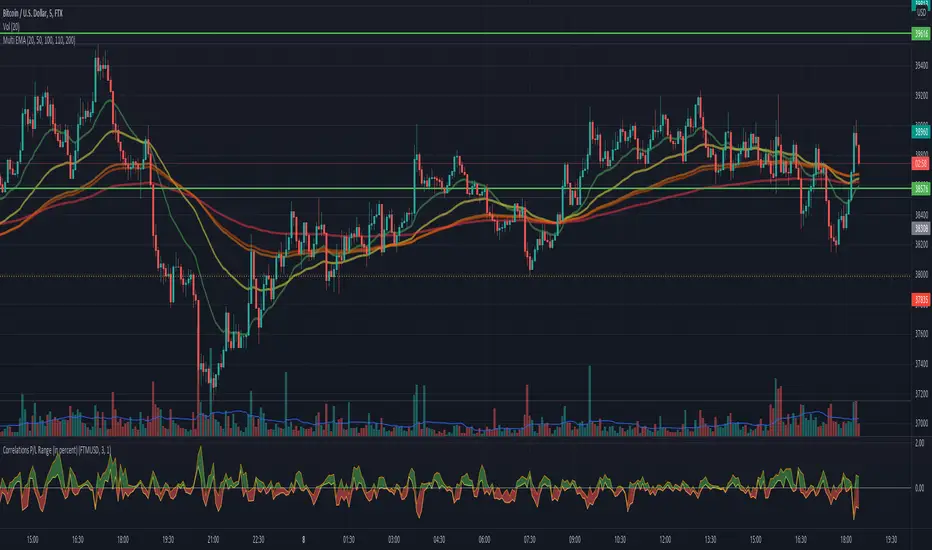
This script shows the inefficiency of the markets.
Comparing two (correlated) symbols, the values above 0 means the main symbol (at the top of the graph)
outperforms the other. A value below 0 means the main symbol underperforms the other.
The band displays different entries until the last candle. Any P/L (of the band range)
is visible in the band. Example: given a band range length of 5, then all last 5 values
are compares with the current value for both symbols. Or in other words:
If symbol A, lets say ETHUSD outperforms, lets say BITCOIN (the main symbol), in the last
5 candles, then we would see all values of the band are negative.
Any question, comment or improvements are welcome.
リリースノート
see description of the scriptオープンソーススクリプト
TradingViewの精神に則り、このスクリプトの作者はコードをオープンソースとして公開してくれました。トレーダーが内容を確認・検証できるようにという配慮です。作者に拍手を送りましょう!無料で利用できますが、コードの再公開はハウスルールに従う必要があります。
免責事項
この情報および投稿は、TradingViewが提供または推奨する金融、投資、トレード、その他のアドバイスや推奨を意図するものではなく、それらを構成するものでもありません。詳細は利用規約をご覧ください。
オープンソーススクリプト
TradingViewの精神に則り、このスクリプトの作者はコードをオープンソースとして公開してくれました。トレーダーが内容を確認・検証できるようにという配慮です。作者に拍手を送りましょう!無料で利用できますが、コードの再公開はハウスルールに従う必要があります。
免責事項
この情報および投稿は、TradingViewが提供または推奨する金融、投資、トレード、その他のアドバイスや推奨を意図するものではなく、それらを構成するものでもありません。詳細は利用規約をご覧ください。