PROTECTED SOURCE SCRIPT
更新済 Stochastic cross up/dn calculator (Picte)
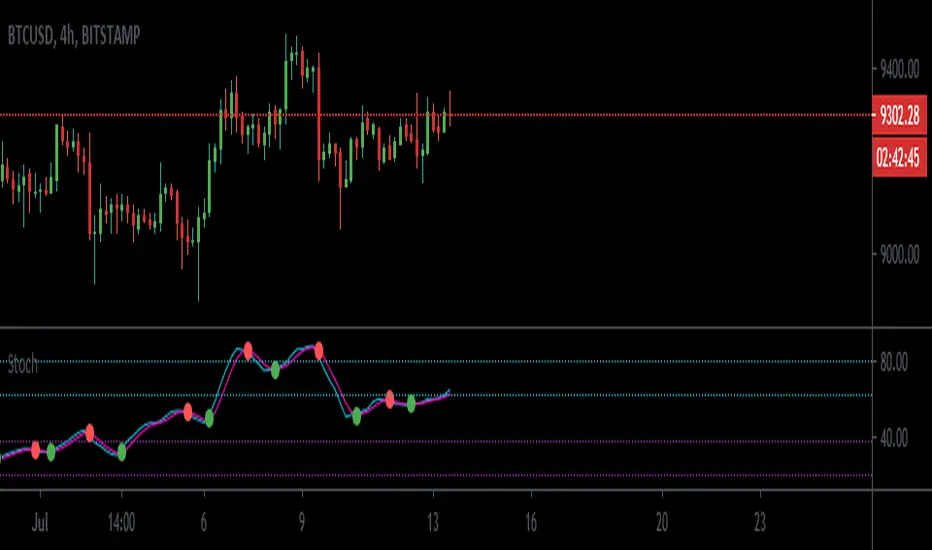
This indicator will calculate the estimated price needed for the stochastic oscillator to change direction. I also included some important horizontal levels for the oscillator. When the oscillator is stuck under the upper purple horizontal we are generally bearish and when it is stuck above the lower blue horizontal we are generally bullish.
The way i like to trade with this oscillator is to see it break a particular support/resistance line and buy/sell it on a retest. I will include some photos of signals i like to take with this indicator below.
I found it useful in the Forex market and also with bitcoin. The traditional market has yet to be tested. I would recommend it being used on time frames above the hourly. It does not mean that lower time frames can not work it is just that higher time frames offer better risk/reward ratio.
signal examples:

ENJOY :)
The way i like to trade with this oscillator is to see it break a particular support/resistance line and buy/sell it on a retest. I will include some photos of signals i like to take with this indicator below.
I found it useful in the Forex market and also with bitcoin. The traditional market has yet to be tested. I would recommend it being used on time frames above the hourly. It does not mean that lower time frames can not work it is just that higher time frames offer better risk/reward ratio.
signal examples:
ENJOY :)
リリースノート
crosses marked保護スクリプト
このスクリプトのソースコードは非公開で投稿されています。 ただし、制限なく自由に使用できます – 詳細はこちらでご確認ください。
免責事項
この情報および投稿は、TradingViewが提供または推奨する金融、投資、トレード、その他のアドバイスや推奨を意図するものではなく、それらを構成するものでもありません。詳細は利用規約をご覧ください。
免責事項
この情報および投稿は、TradingViewが提供または推奨する金融、投資、トレード、その他のアドバイスや推奨を意図するものではなく、それらを構成するものでもありません。詳細は利用規約をご覧ください。