OPEN-SOURCE SCRIPT
GD Momentum
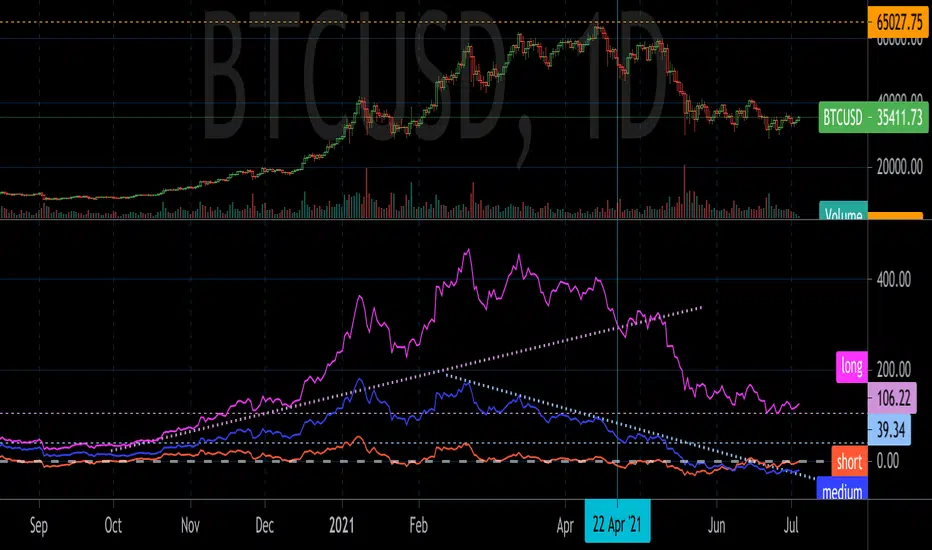
GD Momentum plots short, medium, and long term momentum indicators. The indicators are inspired by momentum structural analysis techniques, and are the % above or below different moving averages. The short term plot is the % above or below the 30 unit moving average, medium is 200 units, and long is 1000 units.
Draw trend lines and horizontal lines to identify the momentum structure and detect trend changes before they show up in price action.
Draw trend lines and horizontal lines to identify the momentum structure and detect trend changes before they show up in price action.
オープンソーススクリプト
TradingViewの精神に則り、このスクリプトの作者はコードをオープンソースとして公開してくれました。トレーダーが内容を確認・検証できるようにという配慮です。作者に拍手を送りましょう!無料で利用できますが、コードの再公開はハウスルールに従う必要があります。
免責事項
この情報および投稿は、TradingViewが提供または推奨する金融、投資、トレード、その他のアドバイスや推奨を意図するものではなく、それらを構成するものでもありません。詳細は利用規約をご覧ください。
オープンソーススクリプト
TradingViewの精神に則り、このスクリプトの作者はコードをオープンソースとして公開してくれました。トレーダーが内容を確認・検証できるようにという配慮です。作者に拍手を送りましょう!無料で利用できますが、コードの再公開はハウスルールに従う必要があります。
免責事項
この情報および投稿は、TradingViewが提供または推奨する金融、投資、トレード、その他のアドバイスや推奨を意図するものではなく、それらを構成するものでもありません。詳細は利用規約をご覧ください。