OPEN-SOURCE SCRIPT
Volume Density Analysis
Volume Density Analysis
Overview
The "Volume Density Analysis" indicator is designed to provide traders with insights into volume dynamics relative to price movements. By analyzing the density of volume against price spread, this indicator helps identify potential reversal points and extreme volume conditions, enhancing decision-making in trading strategies.
Key Features
Volume Density Calculation: The indicator computes the density of volume by dividing the total volume by the price spread (high - low) for each bar. This allows for a more nuanced understanding of volume activity in relation to price movements.
Extremum Detection: Users can specify the number of bars to consider when identifying extreme volume conditions, allowing for tailored analysis based on market behavior.
Reversal Bar Conditions: The indicator includes options to determine if low or high volume bars must coincide with reversal patterns, providing additional context for potential trade signals.
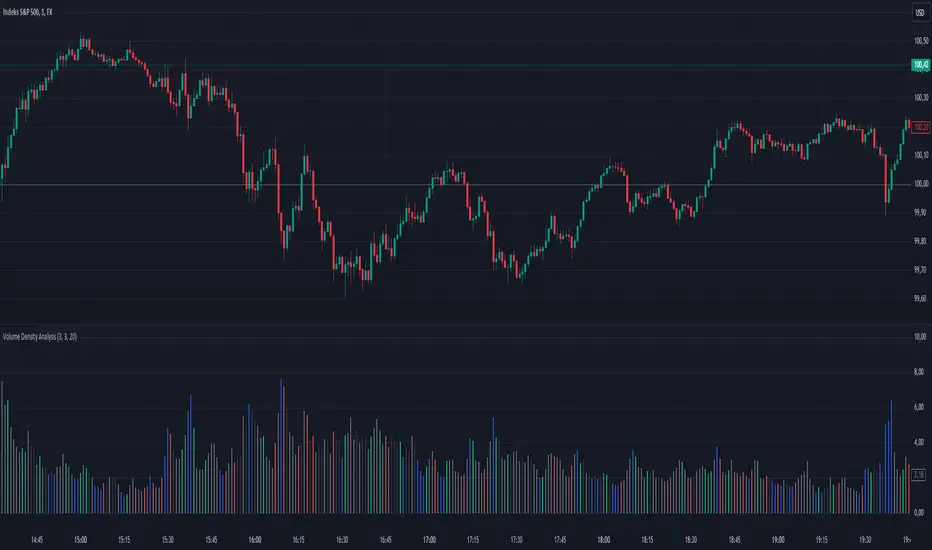
Dynamic Coloring*: The histogram displays colored bars based on specific conditions:
Blue Bars: Indicate the lowest and highest volume density within a specified range, highlighting significant volume extremes.
Gray Bars: Represent lower or higher volume density that meets reversal criteria.
Green and Red Bars: Indicate bullish or bearish reversal signals based on historical density patterns.
User Inputs
nl: Number of previous lower bars to consider for comparison (default is 8).
nh: Number of previous higher bars to consider for comparison (default is 8).
ext: Number of bars for detecting extremum volume (default is 30).
LReversalBar: Boolean option to determine if low volume bar spread must indicate a reversal.
HReversalBar: Boolean option to determine if high volume bar spread must indicate a reversal.
Suggested Timeframes
M15: Without reversal considerations, use `nl=3`, `nh=3`, and `ext=20`.
M5: Without reversal considerations, use `nl=4`, `nh=4`, and `ext=35`.
M1: Use `nl=8`, `nh=8`, and `ext=58` for more detailed analysis.
Overview
The "Volume Density Analysis" indicator is designed to provide traders with insights into volume dynamics relative to price movements. By analyzing the density of volume against price spread, this indicator helps identify potential reversal points and extreme volume conditions, enhancing decision-making in trading strategies.
Key Features
Volume Density Calculation: The indicator computes the density of volume by dividing the total volume by the price spread (high - low) for each bar. This allows for a more nuanced understanding of volume activity in relation to price movements.
Extremum Detection: Users can specify the number of bars to consider when identifying extreme volume conditions, allowing for tailored analysis based on market behavior.
Reversal Bar Conditions: The indicator includes options to determine if low or high volume bars must coincide with reversal patterns, providing additional context for potential trade signals.
Dynamic Coloring*: The histogram displays colored bars based on specific conditions:
Blue Bars: Indicate the lowest and highest volume density within a specified range, highlighting significant volume extremes.
Gray Bars: Represent lower or higher volume density that meets reversal criteria.
Green and Red Bars: Indicate bullish or bearish reversal signals based on historical density patterns.
User Inputs
nl: Number of previous lower bars to consider for comparison (default is 8).
nh: Number of previous higher bars to consider for comparison (default is 8).
ext: Number of bars for detecting extremum volume (default is 30).
LReversalBar: Boolean option to determine if low volume bar spread must indicate a reversal.
HReversalBar: Boolean option to determine if high volume bar spread must indicate a reversal.
Suggested Timeframes
M15: Without reversal considerations, use `nl=3`, `nh=3`, and `ext=20`.
M5: Without reversal considerations, use `nl=4`, `nh=4`, and `ext=35`.
M1: Use `nl=8`, `nh=8`, and `ext=58` for more detailed analysis.
オープンソーススクリプト
TradingViewの精神に則り、このスクリプトの作者はコードをオープンソースとして公開してくれました。トレーダーが内容を確認・検証できるようにという配慮です。作者に拍手を送りましょう!無料で利用できますが、コードの再公開はハウスルールに従う必要があります。
免責事項
この情報および投稿は、TradingViewが提供または推奨する金融、投資、トレード、その他のアドバイスや推奨を意図するものではなく、それらを構成するものでもありません。詳細は利用規約をご覧ください。
オープンソーススクリプト
TradingViewの精神に則り、このスクリプトの作者はコードをオープンソースとして公開してくれました。トレーダーが内容を確認・検証できるようにという配慮です。作者に拍手を送りましょう!無料で利用できますが、コードの再公開はハウスルールに従う必要があります。
免責事項
この情報および投稿は、TradingViewが提供または推奨する金融、投資、トレード、その他のアドバイスや推奨を意図するものではなく、それらを構成するものでもありません。詳細は利用規約をご覧ください。