OPEN-SOURCE SCRIPT
更新済 Volume Weighted Pivot Point Moving Averages VPPMA
As traders and investors, we are constantly on the lookout for tools that can assist us in making informed decisions. While there are countless technical analysis tools available, sometimes even small, simple scripts can provide valuable insights. In this post, we will explore the Volume-Weighted Pivot Point Moving Average (PPMA) Indicator – a modest yet helpful script that could potentially enhance your trading experience.
Background
Pine Script®
The Concept Behind PPMA Indicator
The Volume-Weighted Pivot Point Moving Average (PPMA) Indicator is a straightforward technical analysis tool that aims to help traders identify potential market turning points and trends. It does this by calculating a moving average based on price and volume data while considering pivot highs and pivot lows. The PPMA Indicator is designed to be more responsive than traditional moving averages by incorporating volume into its calculations.
Understanding the Script
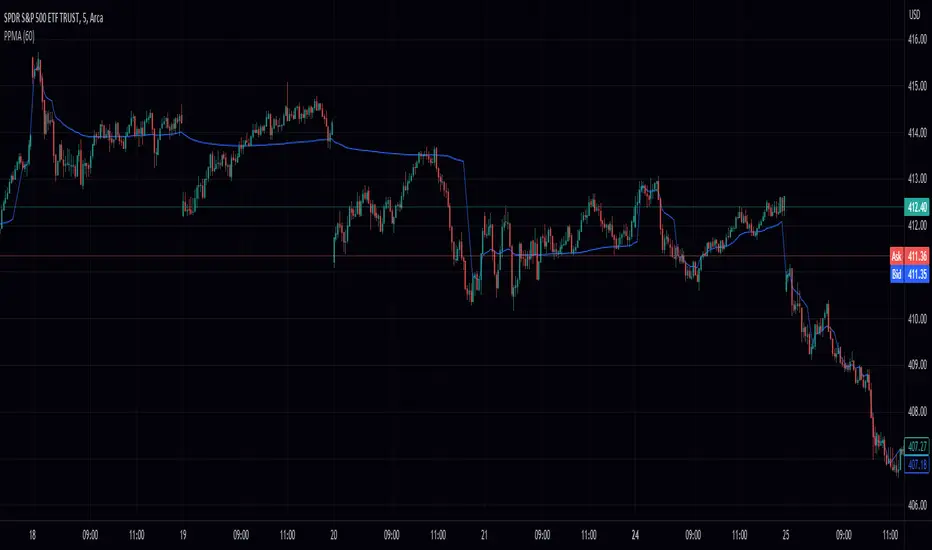
The script is compatible with version 5 of the TradingView Pine Script language, and it features an overlay setting, allowing the indicator to be plotted directly onto the price chart. The customizable pivot left input enables traders to adjust the sensitivity of the pivot points.
The script first identifies pivot points, which are areas where the price changes direction. It then calculates the volume-weighted average price (VWAP) of each trading period between the pivot points. Finally, it plots the PPMA line on the chart, providing a visual representation of the volume-weighted average prices.
Using the PPMA Indicator
To use the PPMA Indicator, simply add the script to your TradingView chart. The indicator will plot the PPMA line directly onto the price chart. You can adjust the pivot left input to modify the sensitivity of the pivot points, depending on your preferred trading style.
When the PPMA line is trending upward, it may indicate a potential bullish trend. Conversely, a downward-trending PPMA line could suggest a bearish trend. The PPMA Indicator can be used in conjunction with other technical analysis tools to confirm potential trend changes and to establish entry or exit points for trades.
Conclusion
While the Volume-Weighted Pivot Point Moving Average (PPMA) Indicator may not be a game-changer, it is a modest yet helpful tool for traders looking to enhance their technical analysis. By incorporating volume into its calculations, the PPMA Indicator aims to provide more responsive signals compared to traditional moving averages. As with any trading tool, it is crucial to conduct your own analysis and combine multiple indicators before making any trading decisions.
Background
// © peacefulLizard50262
//@version=5
indicator("PPMA", overlay = true)
vppma(left, right)=>
signal = ta.change(ta.pivothigh(high, left, right)) or ta.change(ta.pivotlow(low, left, right))
var int count = na
var float sum = na
var float volume_sum = na
if not signal
count := nz(count[1]) + 1
sum := nz(sum[1]) + close * volume
volume_sum := nz(volume_sum[1]) + volume
else
count := na
sum := na
volume_sum := na
sum/volume_sum
left = input.int(50, "Pivot Left", 0)
plot(vppma(left, 0))
The Concept Behind PPMA Indicator
The Volume-Weighted Pivot Point Moving Average (PPMA) Indicator is a straightforward technical analysis tool that aims to help traders identify potential market turning points and trends. It does this by calculating a moving average based on price and volume data while considering pivot highs and pivot lows. The PPMA Indicator is designed to be more responsive than traditional moving averages by incorporating volume into its calculations.
Understanding the Script
The script is compatible with version 5 of the TradingView Pine Script language, and it features an overlay setting, allowing the indicator to be plotted directly onto the price chart. The customizable pivot left input enables traders to adjust the sensitivity of the pivot points.
The script first identifies pivot points, which are areas where the price changes direction. It then calculates the volume-weighted average price (VWAP) of each trading period between the pivot points. Finally, it plots the PPMA line on the chart, providing a visual representation of the volume-weighted average prices.
Using the PPMA Indicator
To use the PPMA Indicator, simply add the script to your TradingView chart. The indicator will plot the PPMA line directly onto the price chart. You can adjust the pivot left input to modify the sensitivity of the pivot points, depending on your preferred trading style.
When the PPMA line is trending upward, it may indicate a potential bullish trend. Conversely, a downward-trending PPMA line could suggest a bearish trend. The PPMA Indicator can be used in conjunction with other technical analysis tools to confirm potential trend changes and to establish entry or exit points for trades.
Conclusion
While the Volume-Weighted Pivot Point Moving Average (PPMA) Indicator may not be a game-changer, it is a modest yet helpful tool for traders looking to enhance their technical analysis. By incorporating volume into its calculations, the PPMA Indicator aims to provide more responsive signals compared to traditional moving averages. As with any trading tool, it is crucial to conduct your own analysis and combine multiple indicators before making any trading decisions.
リリースノート
swapped out for ltb's pivotsオープンソーススクリプト
TradingViewの精神に則り、このスクリプトの作者はコードをオープンソースとして公開してくれました。トレーダーが内容を確認・検証できるようにという配慮です。作者に拍手を送りましょう!無料で利用できますが、コードの再公開はハウスルールに従う必要があります。
免責事項
この情報および投稿は、TradingViewが提供または推奨する金融、投資、トレード、その他のアドバイスや推奨を意図するものではなく、それらを構成するものでもありません。詳細は利用規約をご覧ください。
オープンソーススクリプト
TradingViewの精神に則り、このスクリプトの作者はコードをオープンソースとして公開してくれました。トレーダーが内容を確認・検証できるようにという配慮です。作者に拍手を送りましょう!無料で利用できますが、コードの再公開はハウスルールに従う必要があります。
免責事項
この情報および投稿は、TradingViewが提供または推奨する金融、投資、トレード、その他のアドバイスや推奨を意図するものではなく、それらを構成するものでもありません。詳細は利用規約をご覧ください。