OPEN-SOURCE SCRIPT
Pearson vs Approx. Spearman Correlation
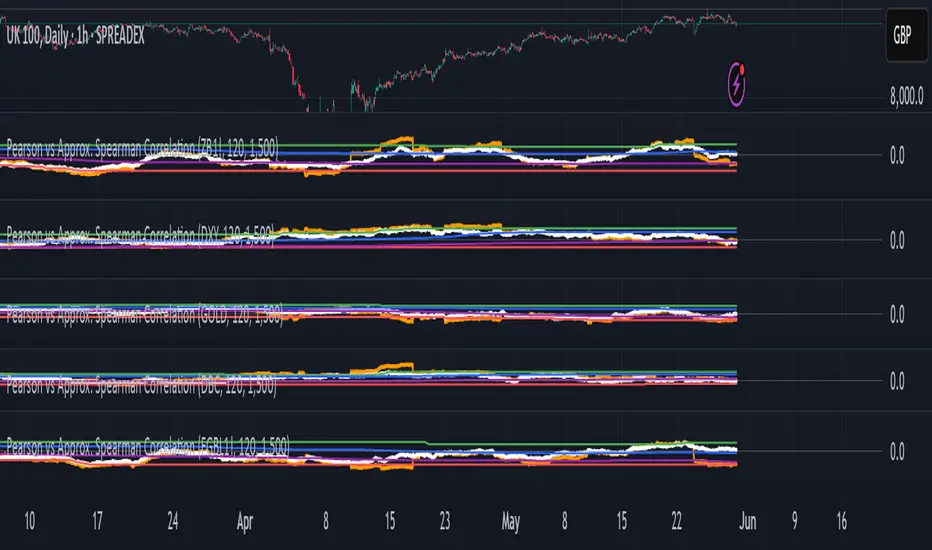
This indicator displays the rolling Pearson and approximate Spearman correlation between the chart's asset and a second user-defined asset, based on log returns over a customizable window.
Features:
- Pearson correlation of log returns (standard linear dependency measure)
- Approximate Spearman correlation, using percentile ranks to better capture nonlinear and monotonic relationships
/ Horizontal lines showing:
Maximum and minimum correlation values over a statistical window
1st quartile (25%) and 3rd quartile (75%) — helpful for identifying statistically high or low regimes
This script is useful for identifying dynamic co-movements, regime changes, or correlation breakdowns between assets — applicable in risk management, portfolio construction, and pairs trading strategies.
オープンソーススクリプト
TradingViewの精神に則り、このスクリプトの作者はコードをオープンソースとして公開してくれました。トレーダーが内容を確認・検証できるようにという配慮です。作者に拍手を送りましょう!無料で利用できますが、コードの再公開はハウスルールに従う必要があります。
免責事項
この情報および投稿は、TradingViewが提供または推奨する金融、投資、トレード、その他のアドバイスや推奨を意図するものではなく、それらを構成するものでもありません。詳細は利用規約をご覧ください。
オープンソーススクリプト
TradingViewの精神に則り、このスクリプトの作者はコードをオープンソースとして公開してくれました。トレーダーが内容を確認・検証できるようにという配慮です。作者に拍手を送りましょう!無料で利用できますが、コードの再公開はハウスルールに従う必要があります。
免責事項
この情報および投稿は、TradingViewが提供または推奨する金融、投資、トレード、その他のアドバイスや推奨を意図するものではなく、それらを構成するものでもありません。詳細は利用規約をご覧ください。