OPEN-SOURCE SCRIPT
Highs and Lows Marker
Indicator Description – Highs and Lows Marker
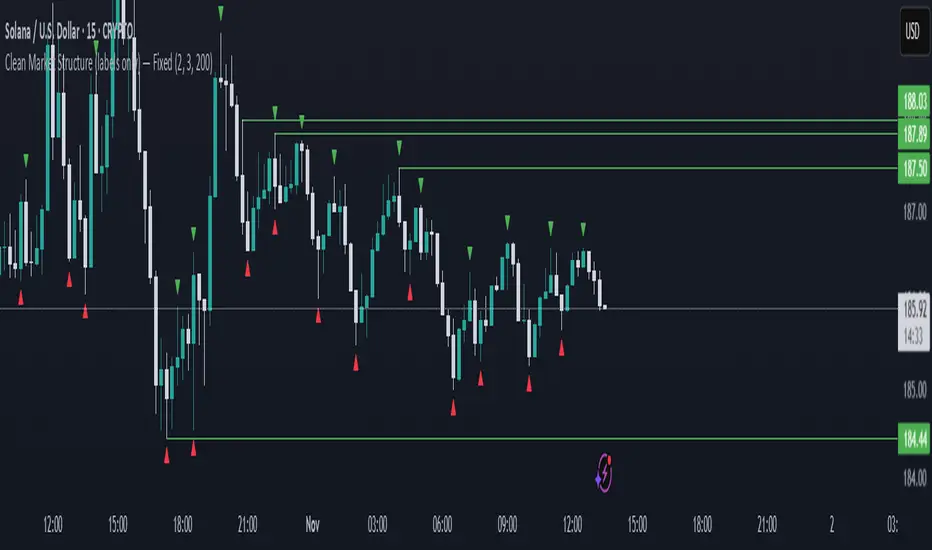
This indicator identifies swing highs and swing lows based on a simple two-candle pattern structure:
High Formation (Swing High):
A High is marked when a bullish candle (Candle Up) is immediately followed by a bearish candle (Candle Down).
The High value is taken as the highest wick price between the two candles in this formation.
This represents a potential short-term resistance or turning point in the market.
Low Formation (Swing Low):
A Low is marked when a bearish candle (Candle Down) is immediately followed by a bullish candle (Candle Up).
The Low value is taken as the lowest wick price between the two candles in this formation.
This represents a potential short-term support or reversal area.
オープンソーススクリプト
TradingViewの精神に則り、このスクリプトの作者はコードをオープンソースとして公開してくれました。トレーダーが内容を確認・検証できるようにという配慮です。作者に拍手を送りましょう!無料で利用できますが、コードの再公開はハウスルールに従う必要があります。
免責事項
この情報および投稿は、TradingViewが提供または推奨する金融、投資、トレード、その他のアドバイスや推奨を意図するものではなく、それらを構成するものでもありません。詳細は利用規約をご覧ください。
オープンソーススクリプト
TradingViewの精神に則り、このスクリプトの作者はコードをオープンソースとして公開してくれました。トレーダーが内容を確認・検証できるようにという配慮です。作者に拍手を送りましょう!無料で利用できますが、コードの再公開はハウスルールに従う必要があります。
免責事項
この情報および投稿は、TradingViewが提供または推奨する金融、投資、トレード、その他のアドバイスや推奨を意図するものではなく、それらを構成するものでもありません。詳細は利用規約をご覧ください。