OPEN-SOURCE SCRIPT
更新済 Crypto/Stable Mcap Ratio Normalized
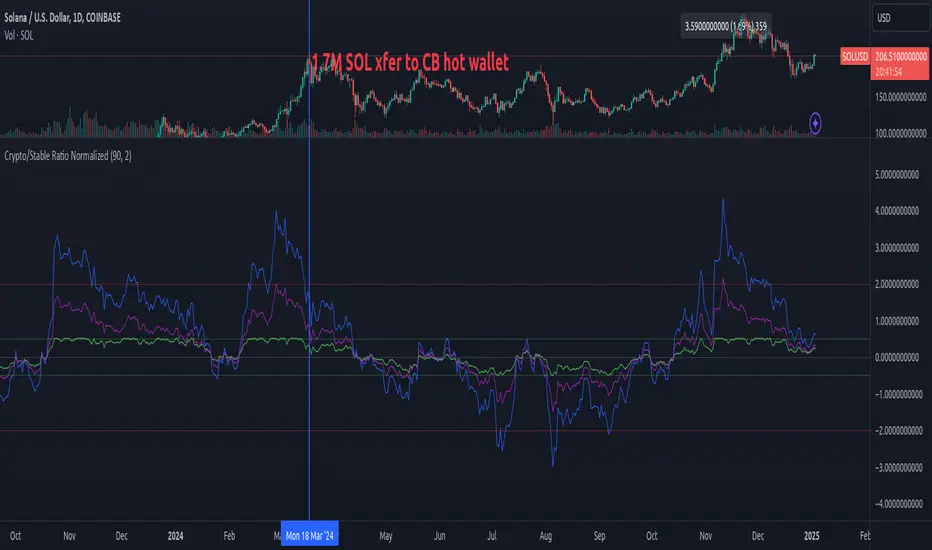
Create a normalized ratio of total crypto market cap to stablecoin supply (USDT + USDC + DAI). Idea is to create a reference point for the total market cap's position, relative to total "dollars" in the crypto ecosystem. It's an imperfect metric, but potentially helpful. V0.1.
This script provides four different normalization methods:
Z-Score Normalization:
Min-Max Normalization:
Percent of All-Time Range:
Bollinger Band Position:
Features:
This script provides four different normalization methods:
Z-Score Normalization:
- Shows how many standard deviations the ratio is from its mean
- Good for identifying extreme values
- Mean-reverting properties
Min-Max Normalization:
- Scales values between 0 and 1
- Good for relative position within recent range
- More sensitive to recent changes
Percent of All-Time Range:
- Shows where current ratio is relative to all-time highs/lows
- Good for historical context
- Less sensitive to recent changes
Bollinger Band Position:
- Similar to z-score but with adjustable sensitivity
- Good for trading signals
- Can be tuned via standard deviation multiplier
Features:
- Adjustable lookback period
- Reference bands for overbought/oversold levels
- Built-in alerts for extreme values
- Color-coded plots for easy visualization
リリースノート
Create a normalized ratio of total crypto market cap to stablecoin supply (USDT + USDC + DAI). Idea is to create a reference point for the total market cap's position, relative to total "dollars" in the crypto ecosystem. It's an imperfect metric, but potentially helpful. V0.1.This script provides four different normalization methods:
Z-Score Normalization:
- Shows how many standard deviations the ratio is from its mean
- Good for identifying extreme values
- Mean-reverting properties
Min-Max Normalization:
- Scales values between 0 and 1
- Good for relative position within recent range
- More sensitive to recent changes
Percent of All-Time Range:
- Shows where current ratio is relative to all-time highs/lows
- Good for historical context
- Less sensitive to recent changes
Bollinger Band Position:
- Similar to z-score but with adjustable sensitivity
- Good for trading signals
- Can be tuned via standard deviation multiplier
Features:
- Adjustable lookback period
- Reference bands for overbought/oversold levels
- Built-in alerts for extreme values
- Color-coded plots for easy visualization
オープンソーススクリプト
TradingViewの精神に則り、このスクリプトの作者はコードをオープンソースとして公開してくれました。トレーダーが内容を確認・検証できるようにという配慮です。作者に拍手を送りましょう!無料で利用できますが、コードの再公開はハウスルールに従う必要があります。
免責事項
この情報および投稿は、TradingViewが提供または推奨する金融、投資、トレード、その他のアドバイスや推奨を意図するものではなく、それらを構成するものでもありません。詳細は利用規約をご覧ください。
オープンソーススクリプト
TradingViewの精神に則り、このスクリプトの作者はコードをオープンソースとして公開してくれました。トレーダーが内容を確認・検証できるようにという配慮です。作者に拍手を送りましょう!無料で利用できますが、コードの再公開はハウスルールに従う必要があります。
免責事項
この情報および投稿は、TradingViewが提供または推奨する金融、投資、トレード、その他のアドバイスや推奨を意図するものではなく、それらを構成するものでもありません。詳細は利用規約をご覧ください。