OPEN-SOURCE SCRIPT
Kamal 5 Tick Trading Setup
Kamal 5 Tick Trading Setup
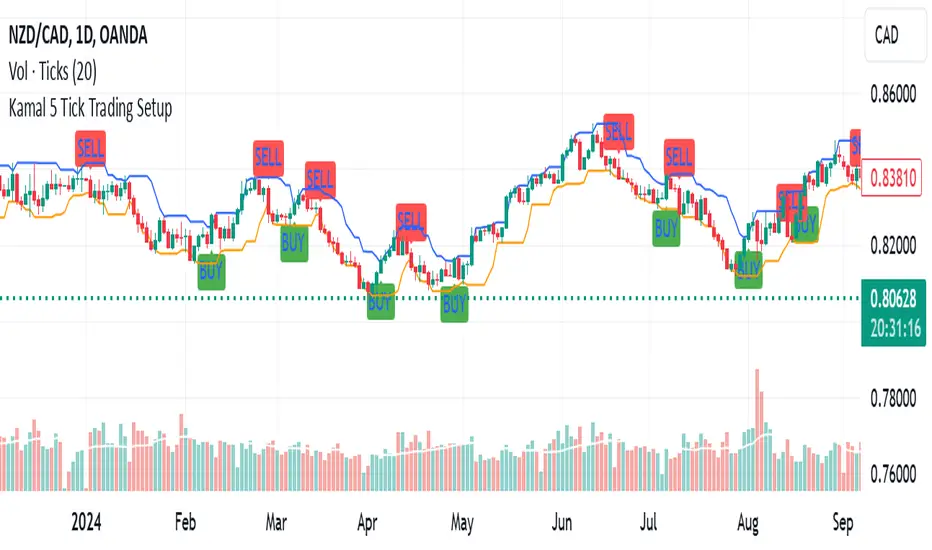
The "Kamal 5 Tick Trading Setup" is a custom indicator designed by Kamal Preet Singh Trader for TradingView to identify potential Buy and Sell signals on daily forex charts. This indicator helps traders make informed decisions based on the price action of the previous five daily candles.
Indicator Logic:
Buy Signal: A Buy signal is generated when the closing price of the current candle exceeds the highest high of the previous five daily candles.
Sell Signal: A Sell signal is generated when the closing price of the current candle falls below the lowest low of the previous five daily candles.
Features:
Lookback Period: The indicator uses a lookback period of five candles to determine the highest high and lowest low.
Visual Signals: Buy signals are plotted as green "BUY" labels below the candles, while Sell signals are plotted as red "SELL" labels above the candles.
Debugging Plots: The highest high and lowest low of the previous five candles are plotted as blue and orange lines, respectively, to help verify the conditions for Buy and Sell signals.
Non-Repetitive Signals: The indicator ensures that once a Buy signal is given, no further Buy signals are generated until a Sell signal is given, and vice versa.
Usage:
Apply the indicator to your daily forex chart in TradingView.
Observe the plotted Buy and Sell signals to identify potential entry and exit points.
Use the debugging plots to ensure the conditions for the signals are being met correctly.
This indicator provides a straightforward approach to trading based on recent price action, helping traders capitalize on potential breakout and breakdown opportunities.
オープンソーススクリプト
TradingViewの精神に則り、このスクリプトの作者はコードをオープンソースとして公開してくれました。トレーダーが内容を確認・検証できるようにという配慮です。作者に拍手を送りましょう!無料で利用できますが、コードの再公開はハウスルールに従う必要があります。
Kamal Preet Singh Trader
免責事項
この情報および投稿は、TradingViewが提供または推奨する金融、投資、トレード、その他のアドバイスや推奨を意図するものではなく、それらを構成するものでもありません。詳細は利用規約をご覧ください。
オープンソーススクリプト
TradingViewの精神に則り、このスクリプトの作者はコードをオープンソースとして公開してくれました。トレーダーが内容を確認・検証できるようにという配慮です。作者に拍手を送りましょう!無料で利用できますが、コードの再公開はハウスルールに従う必要があります。
Kamal Preet Singh Trader
免責事項
この情報および投稿は、TradingViewが提供または推奨する金融、投資、トレード、その他のアドバイスや推奨を意図するものではなく、それらを構成するものでもありません。詳細は利用規約をご覧ください。