PROTECTED SOURCE SCRIPT
更新済 Stochastic Dots
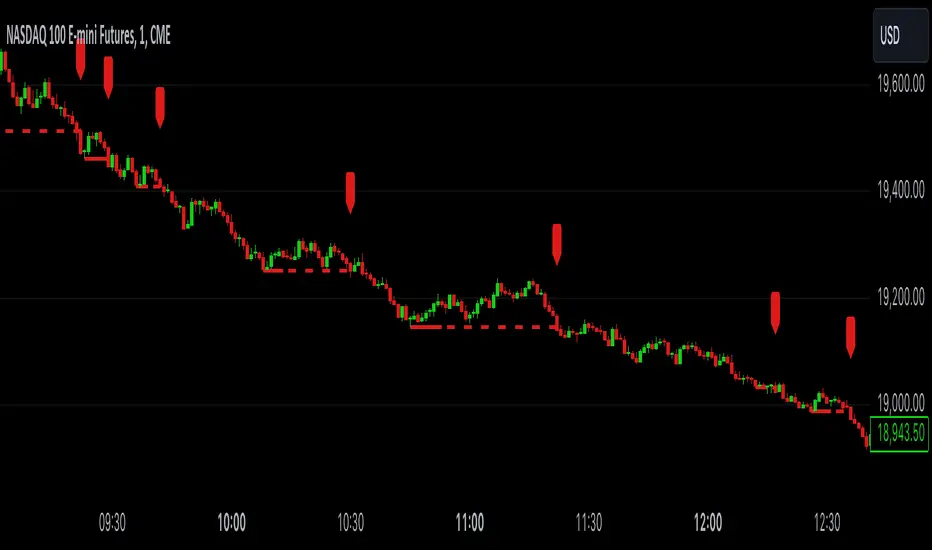
These Stochastic Dots can help show potential turning points and cycles in the market.
- The smaller dots are based off of a faster moving stochastic
- The bigger dots are based off of a longer moving stochastic
- Dots below the candle/bar are bullish
- Dots above the candle/bar are bearish
This indicator is not meant to be traded by itself. Use other forms of confluency and confirmation with it.
If you're interested in more customized indicators to suit your needs, feel free to message me.
リリースノート
Minor Updatesリリースノート
Cleaned Up Settings Tabリリースノート
Trend Mode Added!If the market is trending, turn on Trend Mode and look to enter on breaks of the lines drawn!
Watch This YouTube Video to Learn More:
youtu.be/X2ct87R-cyA?si=Rb3p-ZKQbPPVYjL4
リリースノート
Cleaned up Trend Mode. It is much easier to read now when it is on. Remember, we highly recommend to only use Trend Mode when the market is TRENDING.保護スクリプト
このスクリプトのソースコードは非公開で投稿されています。 ただし、制限なく自由に使用できます – 詳細はこちらでご確認ください。
免責事項
この情報および投稿は、TradingViewが提供または推奨する金融、投資、トレード、その他のアドバイスや推奨を意図するものではなく、それらを構成するものでもありません。詳細は利用規約をご覧ください。
免責事項
この情報および投稿は、TradingViewが提供または推奨する金融、投資、トレード、その他のアドバイスや推奨を意図するものではなく、それらを構成するものでもありません。詳細は利用規約をご覧ください。