OPEN-SOURCE SCRIPT
Yon Hybrid Momentum + Breakout Scanner with BB Squeeze

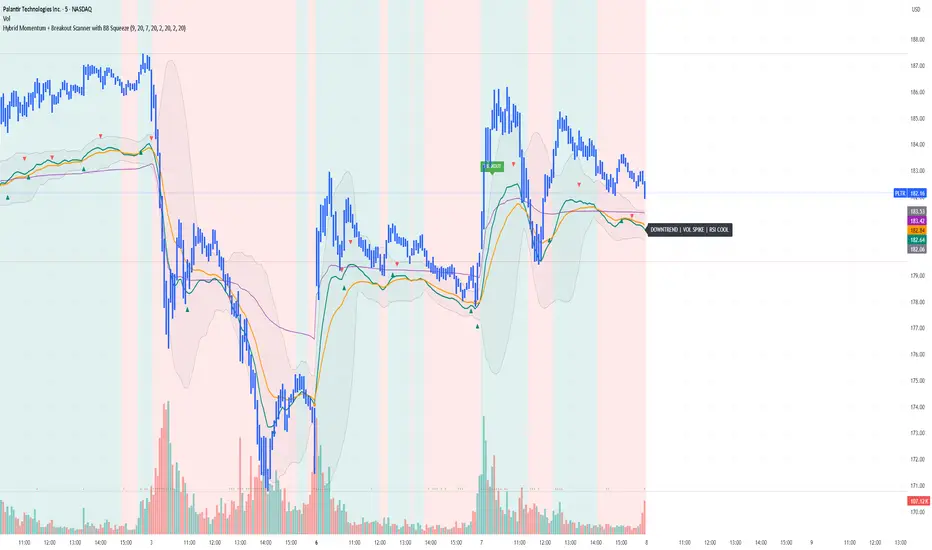
This Pine Script indicator is a comprehensive momentum and breakout scanner that combines multiple technical analysis tools to identify high-probability trading setups. Here's what it does:
Core Features:
1. Trend Identification (EMA System)
Uses two EMAs (9-period fast, 20-period slow) to determine trend direction
Colors the chart background: teal = uptrend, red = downtrend
An uptrend is confirmed when the fast EMA crosses above the slow EMA
2. Volume Analysis
Monitors volume spikes (when current volume exceeds 2x the 20-period average)
Volume spikes often indicate strong institutional interest or breakout momentum
Critical for confirming the validity of price movements
3. Momentum Indicators
MACD (12, 26, 9): Shows bullish/bearish crossovers with triangle markers
RSI (7-period): Identifies overbought (>70) and oversold (<30) conditions
VWAP: Shows the volume-weighted average price (purple line) - helps identify whether price is trading at fair value
4. Bollinger Bands & Squeeze Detection
Displays Bollinger Bands (20-period, 2 standard deviations)
BB Squeeze: Detects when volatility contracts to its lowest level in 20 bars
Squeezes often precede explosive breakout moves (like a coiled spring)
Orange squares appear at the bottom when a squeeze is detected
5. Breakout Detection
The script identifies breakouts using TWO methods:
Price breakout: Close above the recent 20-bar high
BB breakout: Close above the upper Bollinger Band
Confirmed breakout: Must have uptrend + volume spike + one of the above conditions
Shows a green "BREAKOUT" label when all conditions align
6. Live Status Label
A label in the top-right displays real-time market conditions:
Current trend (UPTREND/DOWNTREND)
Volume status (VOL SPIKE/Normal Vol)
RSI condition (HOT/COOL/Neutral)
Squeeze status (if active)
7. Alerts
Two automated alerts:
Breakout Alert: Triggers when a confirmed breakout occurs
Squeeze Alert: Triggers when Bollinger Bands enter a squeeze
Trading Use Cases:
This indicator is ideal for:
Swing traders looking for momentum setups with strong volume confirmation
Breakout traders who want to catch explosive moves after consolidation
Day traders monitoring multiple timeframes for high-probability entries
Watchlist scanning to quickly identify which stocks/cryptos are showing momentum
How to Use It:
Setup Phase: Look for BB squeeze markers (orange squares) - these signal compression
Confirmation: Wait for volume spike + uptrend + MACD bullish crossover
Entry: When "BREAKOUT" label appears with all confirmations
Validation: Price should be above VWAP and RSI not extremely overbought
The script essentially automates the process of finding stocks that are "coiling up" and ready to make a big move, then confirms when that move actually happens with volume.
オープンソーススクリプト
TradingViewの精神に則り、このスクリプトの作者はコードをオープンソースとして公開してくれました。トレーダーが内容を確認・検証できるようにという配慮です。作者に拍手を送りましょう!無料で利用できますが、コードの再公開はハウスルールに従う必要があります。
免責事項
この情報および投稿は、TradingViewが提供または推奨する金融、投資、トレード、その他のアドバイスや推奨を意図するものではなく、それらを構成するものでもありません。詳細は利用規約をご覧ください。
オープンソーススクリプト
TradingViewの精神に則り、このスクリプトの作者はコードをオープンソースとして公開してくれました。トレーダーが内容を確認・検証できるようにという配慮です。作者に拍手を送りましょう!無料で利用できますが、コードの再公開はハウスルールに従う必要があります。
免責事項
この情報および投稿は、TradingViewが提供または推奨する金融、投資、トレード、その他のアドバイスや推奨を意図するものではなく、それらを構成するものでもありません。詳細は利用規約をご覧ください。