OPEN-SOURCE SCRIPT
Dynamic Candle Balance Indicator (Binary)
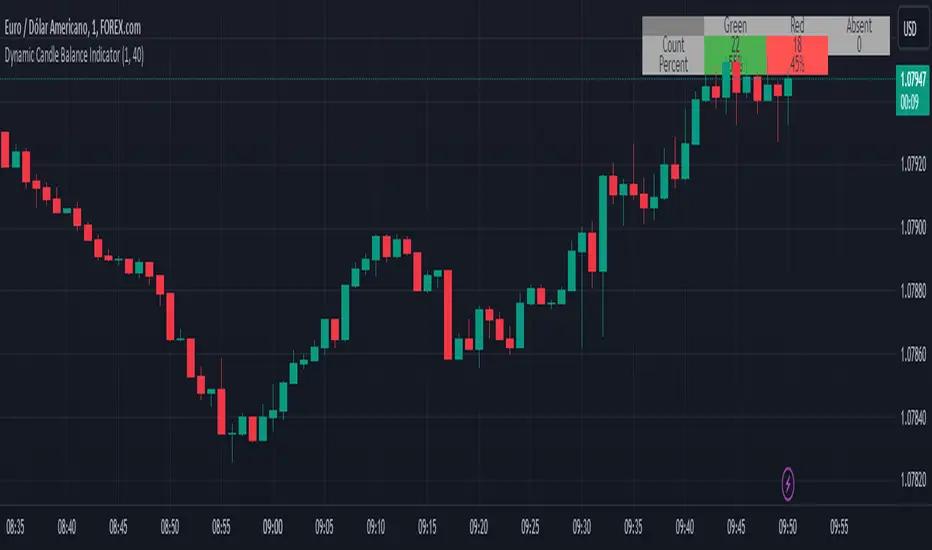
Dynamic Candle Balance Indicator
The Dynamic Candle Balance Indicator is a powerful tool designed to identify imbalances in candle colors on a chart, which can indicate potential reversals or changes in market direction. This indicator is specifically developed for traders operating on short timeframes, such as 1-minute candles, and is particularly useful for identifying opportunities in binary options.
How to Use:
Set Parameters
Initial Position: Specify the number of initial candles to be considered for calculation.
Count: Determine the total number of candles to be analyzed, including the initial position.
Interpret Results:
Green: Indicates the number of bullish candles (where the closing price is higher than the opening price).
Red: Indicates the number of bearish candles (where the closing price is lower than the opening price).
Absent: Indicates the number of candles that were not considered due to the selected interval.
Performance Analysis:
The indicator calculates the percentage of green and red candles relative to the total number of analyzed candles, providing insights into market balance or imbalance.
Identify Trading Opportunities:
Significant imbalances between candle colors can indicate potential reversals or changes in market direction.
Traders can use this information to make informed decisions about their trading strategies, such as identifying entry or exit points.
Example:
In the last 40 candles, there were 13 green candles and 27 red candles, indicating a higher likelihood of the next candle being green.
Usage Tips:
The indicator is most effective when used on a 1-minute timeframe for binary options trading, especially during periods of high imbalance.
Adjust the parameters according to your trading strategy and the timeframe being analyzed.
Combine the Dynamic Candle Balance Indicator with other technical analysis tools to confirm trading signals.
Legal Disclaimer:
This indicator is provided for educational and informational purposes only. It represents a theory and should be used as part of a comprehensive trading strategy. Past performance is not indicative of future results. Traders should always conduct their own analysis before making trading decisions.
Try out the Dynamic Candle Balance Indicator and leverage its functionalities to identify trading opportunities on short-term charts, especially in 1-minute timeframes for binary options trading during periods of high imbalance. Remember to test the indicator on a practice account before using it on a real account.
オープンソーススクリプト
TradingViewの精神に則り、このスクリプトの作者はコードをオープンソースとして公開してくれました。トレーダーが内容を確認・検証できるようにという配慮です。作者に拍手を送りましょう!無料で利用できますが、コードの再公開はハウスルールに従う必要があります。
免責事項
この情報および投稿は、TradingViewが提供または推奨する金融、投資、トレード、その他のアドバイスや推奨を意図するものではなく、それらを構成するものでもありません。詳細は利用規約をご覧ください。
オープンソーススクリプト
TradingViewの精神に則り、このスクリプトの作者はコードをオープンソースとして公開してくれました。トレーダーが内容を確認・検証できるようにという配慮です。作者に拍手を送りましょう!無料で利用できますが、コードの再公開はハウスルールに従う必要があります。
免責事項
この情報および投稿は、TradingViewが提供または推奨する金融、投資、トレード、その他のアドバイスや推奨を意図するものではなく、それらを構成するものでもありません。詳細は利用規約をご覧ください。