OPEN-SOURCE SCRIPT
Price Trend Indicator+
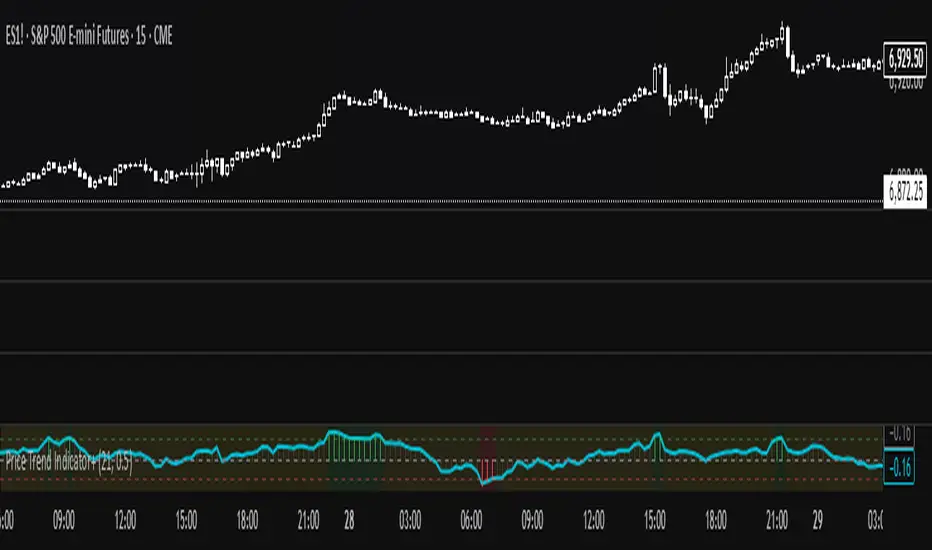
🧠 What it does
It measures the ratio between average price change and average volatility, showing how strong and directional the trend is.
Higher positive values = steady uptrend, negative = downtrend
📊 How to interpret
P value Signal Meaning
P > +0.5 🟢 Strong Uptrend Steady upward movement
0 < P < +0.5 🟡 Mild Uptrend Weak upward bias
P ≈ 0 ⚪ Sideways No clear direction
-0.5 < P < 0 🟠 Mild Downtrend Slight downward bias
P < -0.5 🔴 Strong Downtrend Consistent decline
オープンソーススクリプト
TradingViewの精神に則り、このスクリプトの作者はコードをオープンソースとして公開してくれました。トレーダーが内容を確認・検証できるようにという配慮です。作者に拍手を送りましょう!無料で利用できますが、コードの再公開はハウスルールに従う必要があります。
免責事項
この情報および投稿は、TradingViewが提供または推奨する金融、投資、トレード、その他のアドバイスや推奨を意図するものではなく、それらを構成するものでもありません。詳細は利用規約をご覧ください。
オープンソーススクリプト
TradingViewの精神に則り、このスクリプトの作者はコードをオープンソースとして公開してくれました。トレーダーが内容を確認・検証できるようにという配慮です。作者に拍手を送りましょう!無料で利用できますが、コードの再公開はハウスルールに従う必要があります。
免責事項
この情報および投稿は、TradingViewが提供または推奨する金融、投資、トレード、その他のアドバイスや推奨を意図するものではなく、それらを構成するものでもありません。詳細は利用規約をご覧ください。