OPEN-SOURCE SCRIPT
Dynamic Price Impulse
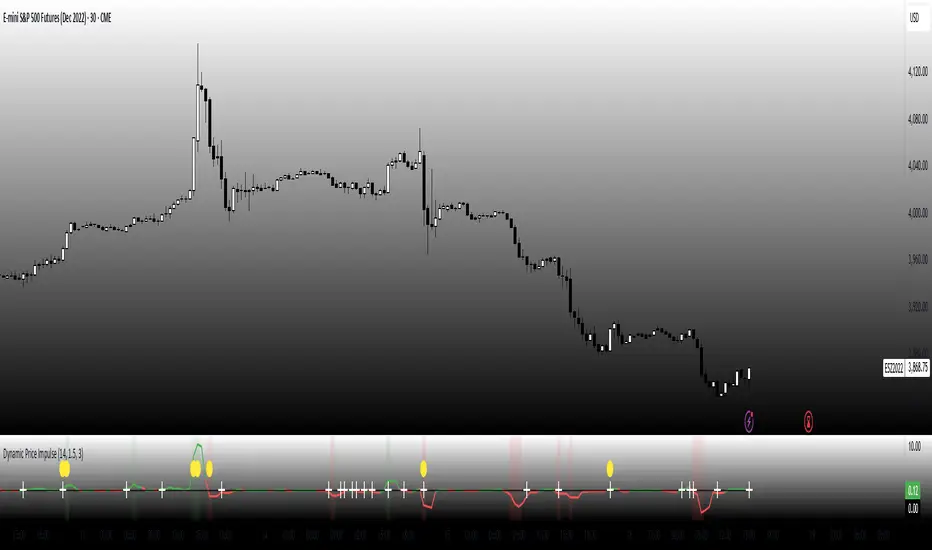
This indicator is designed to capture price momentum without the lag typically found in traditional oscillators.
Core Mechanics
Instead of using simple price differences, the indicator normalizes changes relative to the average true range (ATR), making it adaptive to different volatility regimes.
By squaring the normalized change while preserving its sign, the indicator responds more aggressively to stronger price moves while remaining sensitive to smaller ones.
The indicator identifies periods when volatility is expanding, which often precede significant price movements.
Trading Strategy Applications
1. Momentum Signals:
o When the indicator crosses above zero, look for long entries
o When it crosses below zero, look for short entries
o The stronger the impulse (farther from zero), the stronger the signal
2. Early Trend Detection:
o Volatility expansion markers (yellow circles) often appear at the beginning of new trends
o Use these as early warning signals to prepare for potential entries
3. Trend Continuation:
o Strong readings in the direction of the trend suggest continuation
o Weakening readings suggest the trend may be losing steam
4. Counter-Trend Opportunities:
o Look for divergences between price and the indicator for potential reversals
o When price makes a new high but the indicator doesn't, consider potential shorts (and vice versa)
Fine-Tuning
• Length (14): Controls the lookback period for ATR calculation. Lower values make it more responsive but noisier.
• Threshold (1.5): Determines how much volatility needs to expand to trigger the volatility expansion signal.
• Smoothing (3): Reduces noise in the signal. Higher values reduce false signals but introduce more lag.
オープンソーススクリプト
TradingViewの精神に則り、このスクリプトの作者はコードをオープンソースとして公開してくれました。トレーダーが内容を確認・検証できるようにという配慮です。作者に拍手を送りましょう!無料で利用できますが、コードの再公開はハウスルールに従う必要があります。
免責事項
この情報および投稿は、TradingViewが提供または推奨する金融、投資、トレード、その他のアドバイスや推奨を意図するものではなく、それらを構成するものでもありません。詳細は利用規約をご覧ください。
オープンソーススクリプト
TradingViewの精神に則り、このスクリプトの作者はコードをオープンソースとして公開してくれました。トレーダーが内容を確認・検証できるようにという配慮です。作者に拍手を送りましょう!無料で利用できますが、コードの再公開はハウスルールに従う必要があります。
免責事項
この情報および投稿は、TradingViewが提供または推奨する金融、投資、トレード、その他のアドバイスや推奨を意図するものではなく、それらを構成するものでもありません。詳細は利用規約をご覧ください。