OPEN-SOURCE SCRIPT
更新済 Candlestick Trend Strength [AlgoAlpha]
🚀🎉 Introducing the Candlestick Trend Strength by AlgoAlpha, a dynamic TradingView indicator designed to visually communicate the strength and direction of market trends right on your charts! 🕯️💪
Key Features:
How to Use:
Basic Logic Explained:
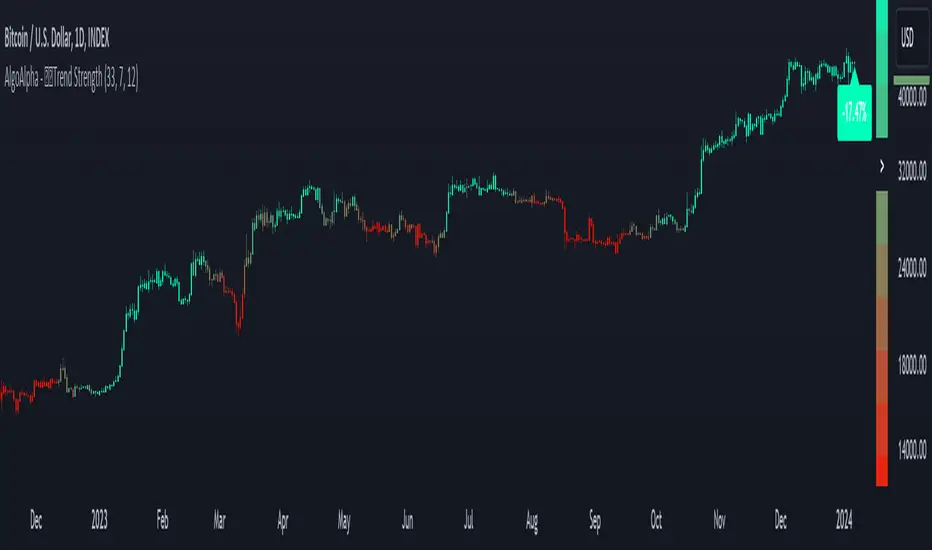
The "Candlestick Trend Strength" indicator calculates the trend strength score by analyzing the ratio of the candle's wick to its body, alongside the direction of the candle (up or down). It uses a normalization period to adjust the sum of the trend score into a scale from -1 to 1, which is then plotted as a color gradient gauge from red (downtrend) to green (uptrend) on the chart. This representation helps traders quickly assess whether a trend is gaining or losing strength, and it updates in real-time with each new bar, providing a highly responsive tool for technical analysis.
Embrace the power of visual trend analysis with the "Candlestick Trend Strength" by AlgoAlpha and transform your trading experience today! 🌟📈
Key Features:
- 🌈 Visual gauge for trend strength, color-coded for intuitive insights.
- ⏳ Customizable trend detection and normalization periods to match your trading strategy.
- 🎨 Flexible color settings for both uptrend (green) and downtrend (red).
- 🔔 Real-time alerts for trend reversals, helping you stay ahead of market moves.
How to Use:
- 🛠 Add the Indicator: Add the indicator to favorites and customize it to suit your needs.
- 🔍 Analyze the Trends: Monitor the color changes in the gauge and bar color to identify strengthening or weakening trends.
- 🔔 Set Alerts: Configure alerts to notify you of trend changes, allowing you to react swiftly to trading opportunities without constant monitoring.
Basic Logic Explained:
The "Candlestick Trend Strength" indicator calculates the trend strength score by analyzing the ratio of the candle's wick to its body, alongside the direction of the candle (up or down). It uses a normalization period to adjust the sum of the trend score into a scale from -1 to 1, which is then plotted as a color gradient gauge from red (downtrend) to green (uptrend) on the chart. This representation helps traders quickly assess whether a trend is gaining or losing strength, and it updates in real-time with each new bar, providing a highly responsive tool for technical analysis.
Embrace the power of visual trend analysis with the "Candlestick Trend Strength" by AlgoAlpha and transform your trading experience today! 🌟📈
リリースノート
Updated Labels to appear only on latest bar and to the right of the bar.オープンソーススクリプト
TradingViewの精神に則り、このスクリプトの作者はコードをオープンソースとして公開してくれました。トレーダーが内容を確認・検証できるようにという配慮です。作者に拍手を送りましょう!無料で利用できますが、コードの再公開はハウスルールに従う必要があります。
🚨Get premium for 50% OFF (ends Jan 31st): algoalpha.io
🛜Get FREE signals: discord.gg/xCmqTVRexz
💡Tutorials: youtube.com/@AlgoAlpha
🛜Get FREE signals: discord.gg/xCmqTVRexz
💡Tutorials: youtube.com/@AlgoAlpha
免責事項
この情報および投稿は、TradingViewが提供または推奨する金融、投資、トレード、その他のアドバイスや推奨を意図するものではなく、それらを構成するものでもありません。詳細は利用規約をご覧ください。
オープンソーススクリプト
TradingViewの精神に則り、このスクリプトの作者はコードをオープンソースとして公開してくれました。トレーダーが内容を確認・検証できるようにという配慮です。作者に拍手を送りましょう!無料で利用できますが、コードの再公開はハウスルールに従う必要があります。
🚨Get premium for 50% OFF (ends Jan 31st): algoalpha.io
🛜Get FREE signals: discord.gg/xCmqTVRexz
💡Tutorials: youtube.com/@AlgoAlpha
🛜Get FREE signals: discord.gg/xCmqTVRexz
💡Tutorials: youtube.com/@AlgoAlpha
免責事項
この情報および投稿は、TradingViewが提供または推奨する金融、投資、トレード、その他のアドバイスや推奨を意図するものではなく、それらを構成するものでもありません。詳細は利用規約をご覧ください。