OPEN-SOURCE SCRIPT
CarrerasTrend
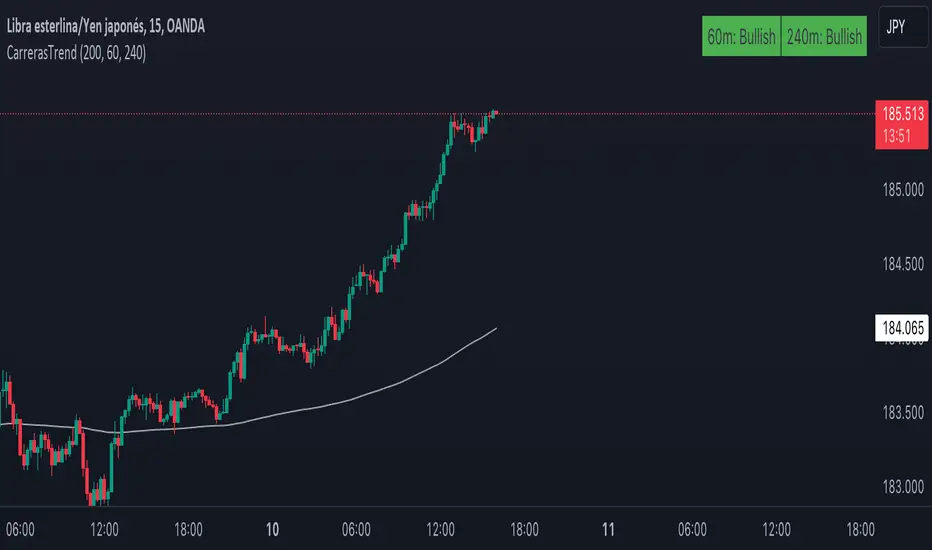
This indicator, created by Maximiliano Carreras, displays the trend based on the 200-period EMA (Adjustable) on the chart. The EMA is calculated based on data from the 1-hour and 4-hour charts (Both adjustable timeframes). The indicator labels the trend as "Bullish" if the closing price is above the EMA and as "Bearish" if it is below. The indicator is shown in the top right corner of the chart, providing information about the overall trend of the underlying asset.
You can also choose whether to display the EMA on the chart or not, as well as select between 1 or 2 timeframes for display.
Feel free to leave a comment if you liked it!
Ahora en Español:
Este indicador, creado por Maximiliano Carreras, muestra la tendencia basada en la EMA de 200 periodos (Modificable) en el gráfico. La EMA es calculada en función de los datos del gráfico de 1 y 4 horas (Modificables ambos tiempos). El indicador etiqueta la tendencia como "Bullish" (alcista) si el precio de cierre está por encima de la EMA y como "Bearish" (bajista) si está por debajo. El indicador se muestra en la esquina superior derecha del gráfico, proporcionando información sobre la tendencia general del activo subyacente.
También se puede mostrar o no la ema en el gráfico, al igual si elegir 1 o 2 tiempos para mostrar
Dejame un comentario si te gustó
オープンソーススクリプト
TradingViewの精神に則り、このスクリプトの作者はコードをオープンソースとして公開してくれました。トレーダーが内容を確認・検証できるようにという配慮です。作者に拍手を送りましょう!無料で利用できますが、コードの再公開はハウスルールに従う必要があります。
免責事項
この情報および投稿は、TradingViewが提供または推奨する金融、投資、トレード、その他のアドバイスや推奨を意図するものではなく、それらを構成するものでもありません。詳細は利用規約をご覧ください。
オープンソーススクリプト
TradingViewの精神に則り、このスクリプトの作者はコードをオープンソースとして公開してくれました。トレーダーが内容を確認・検証できるようにという配慮です。作者に拍手を送りましょう!無料で利用できますが、コードの再公開はハウスルールに従う必要があります。
免責事項
この情報および投稿は、TradingViewが提供または推奨する金融、投資、トレード、その他のアドバイスや推奨を意図するものではなく、それらを構成するものでもありません。詳細は利用規約をご覧ください。