OPEN-SOURCE SCRIPT
更新済 Dev's PDH PDL super strategy
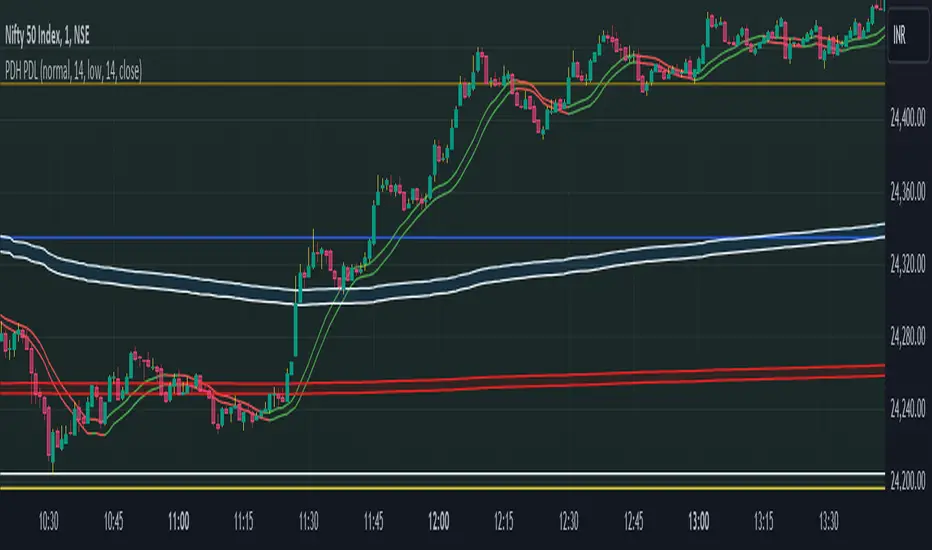
Have plotted Previous day High, previous day low, previous day close and previous day open. Moreover Previous month High and low are plotted. Background changes are made as per this concept: when the current day's price is above PDL and below PDH, a green background when the current price is above both PDL and PDH, and a red background when the current day's price is below both PDL and PDH.
Current day High and low are plotted as white lines, which are dynamic and change once new high or low forms.
Current day High and low are plotted as white lines, which are dynamic and change once new high or low forms.
リリースノート
Added sma and current day's openリリースノート
Added vwap cloudsオープンソーススクリプト
TradingViewの精神に則り、このスクリプトの作者はコードをオープンソースとして公開してくれました。トレーダーが内容を確認・検証できるようにという配慮です。作者に拍手を送りましょう!無料で利用できますが、コードの再公開はハウスルールに従う必要があります。
免責事項
この情報および投稿は、TradingViewが提供または推奨する金融、投資、トレード、その他のアドバイスや推奨を意図するものではなく、それらを構成するものでもありません。詳細は利用規約をご覧ください。
オープンソーススクリプト
TradingViewの精神に則り、このスクリプトの作者はコードをオープンソースとして公開してくれました。トレーダーが内容を確認・検証できるようにという配慮です。作者に拍手を送りましょう!無料で利用できますが、コードの再公開はハウスルールに従う必要があります。
免責事項
この情報および投稿は、TradingViewが提供または推奨する金融、投資、トレード、その他のアドバイスや推奨を意図するものではなく、それらを構成するものでもありません。詳細は利用規約をご覧ください。