OPEN-SOURCE SCRIPT
Volume Volatality Indicator
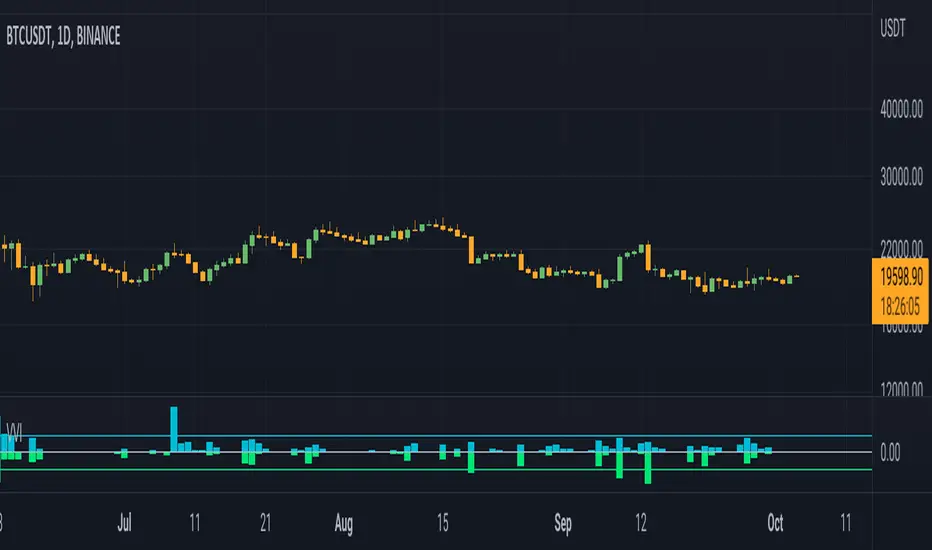
Volume Volatility Indicator
vol: volume; vma: rma of volume
Cyan column shows (vol - vma)/vma, if vol > vma else shows 0
0 value means vol less than vma: good for continuation
0 < value < 1 means vol more than vma: good for trend
value > 1 means vol more than 2 * vma: good for reversal
tr: truerange; atr: averagetruerange
Lime column show -(tr - atr)/atr, if tr > atr else show 0
0 value means tr less than atr: good for continuation
0 > value > -1 means tr more than atr: good for trend
value < -1 means tr more than 2 * atr: good for reversal
Cyan line = 1
Lime line = -1
This indicator shows the volume and truerange together.
Good for filtering trending and consolidating markets.
Thanks for the support.
オープンソーススクリプト
TradingViewの精神に則り、このスクリプトの作者はコードをオープンソースとして公開してくれました。トレーダーが内容を確認・検証できるようにという配慮です。作者に拍手を送りましょう!無料で利用できますが、コードの再公開はハウスルールに従う必要があります。
免責事項
この情報および投稿は、TradingViewが提供または推奨する金融、投資、トレード、その他のアドバイスや推奨を意図するものではなく、それらを構成するものでもありません。詳細は利用規約をご覧ください。
オープンソーススクリプト
TradingViewの精神に則り、このスクリプトの作者はコードをオープンソースとして公開してくれました。トレーダーが内容を確認・検証できるようにという配慮です。作者に拍手を送りましょう!無料で利用できますが、コードの再公開はハウスルールに従う必要があります。
免責事項
この情報および投稿は、TradingViewが提供または推奨する金融、投資、トレード、その他のアドバイスや推奨を意図するものではなく、それらを構成するものでもありません。詳細は利用規約をご覧ください。