OPEN-SOURCE SCRIPT
更新済 TICK and Price Action Indicator for NQ 5 minute
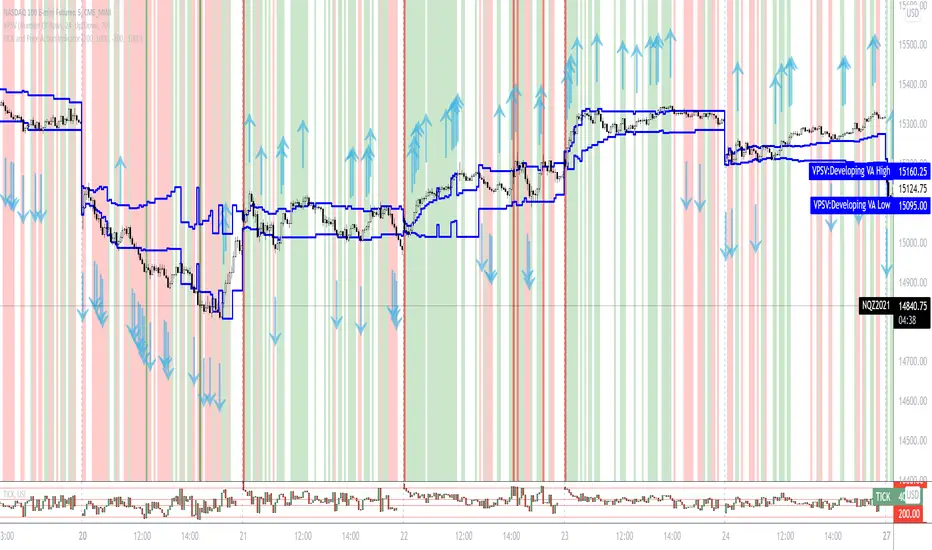
This indicator for 5 minute NQ charts utilises TICK index and price action.
Where TICK opens beyond +1000/-1000 this is an overbought/oversold signal.
Similarly, when TICK closes below -200 it is a sell signal, and above +200 it is a buy signal.
This indicator colours the NQ bars based on the closing/opening values of the previous TICK.
It also draws arrows where price action (close above previous high, close below previous low) is in concordance with TICK behaviour.
リリースノート
Debugged code that limited the number of buy signals; debugged code that would otherwise show a number of short signalsオープンソーススクリプト
TradingViewの精神に則り、このスクリプトの作者はコードをオープンソースとして公開してくれました。トレーダーが内容を確認・検証できるようにという配慮です。作者に拍手を送りましょう!無料で利用できますが、コードの再公開はハウスルールに従う必要があります。
免責事項
この情報および投稿は、TradingViewが提供または推奨する金融、投資、トレード、その他のアドバイスや推奨を意図するものではなく、それらを構成するものでもありません。詳細は利用規約をご覧ください。
オープンソーススクリプト
TradingViewの精神に則り、このスクリプトの作者はコードをオープンソースとして公開してくれました。トレーダーが内容を確認・検証できるようにという配慮です。作者に拍手を送りましょう!無料で利用できますが、コードの再公開はハウスルールに従う必要があります。
免責事項
この情報および投稿は、TradingViewが提供または推奨する金融、投資、トレード、その他のアドバイスや推奨を意図するものではなく、それらを構成するものでもありません。詳細は利用規約をご覧ください。