OPEN-SOURCE SCRIPT
更新済 Student's T-Distribution Bollinger Bands
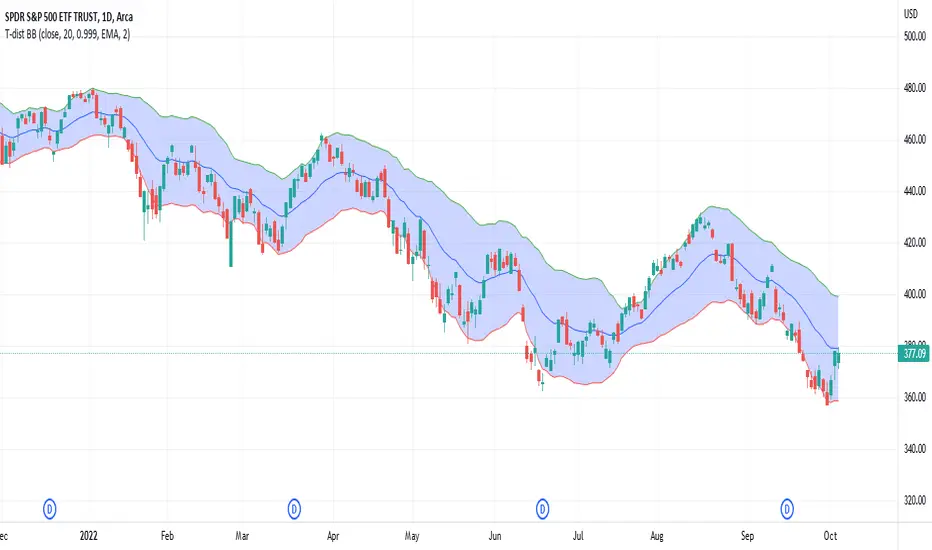
This study shows the prediction interval as Bollinger Bands using Student's T-distribution. This means that the bands will be wider when the data features higher variation, as well as when the sample size (in the form of length) is smaller. The bands will also be wider when the confidence level is lower. The opposite is also true. Assuming we set a confidence level of 0.99 and a source set to the close price, we could reasonably expect that 99% of the time the close price would fall between the upper and lower bounds. Because this is a general statistical method which requires a lot of math, the script has a tendency to be relatively slow, but should be eligible to be used in a wide variety of situations.
リリースノート
Updated int types to floats so floor division doesn't cause bands to failオープンソーススクリプト
TradingViewの精神に則り、このスクリプトの作者はコードをオープンソースとして公開してくれました。トレーダーが内容を確認・検証できるようにという配慮です。作者に拍手を送りましょう!無料で利用できますが、コードの再公開はハウスルールに従う必要があります。
免責事項
この情報および投稿は、TradingViewが提供または推奨する金融、投資、トレード、その他のアドバイスや推奨を意図するものではなく、それらを構成するものでもありません。詳細は利用規約をご覧ください。
オープンソーススクリプト
TradingViewの精神に則り、このスクリプトの作者はコードをオープンソースとして公開してくれました。トレーダーが内容を確認・検証できるようにという配慮です。作者に拍手を送りましょう!無料で利用できますが、コードの再公開はハウスルールに従う必要があります。
免責事項
この情報および投稿は、TradingViewが提供または推奨する金融、投資、トレード、その他のアドバイスや推奨を意図するものではなく、それらを構成するものでもありません。詳細は利用規約をご覧ください。