OPEN-SOURCE SCRIPT
Crypto Heatmap [Pinescriptlabs]
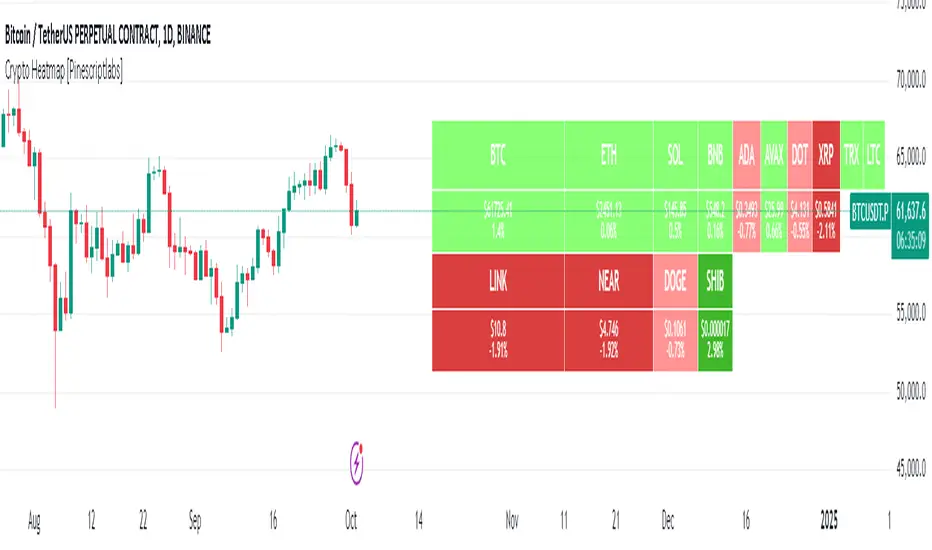
🌟 Crypto Heatmap is a visual tool that enables quick and efficient visualization of price behavior and percentage changes of various cryptocurrencies.
📊 It generates a heatmap to show variations in daily closing prices, helping traders quickly identify assets with the most movement.
📈 Percentage Change Calculation: It calculates the difference between the current price and the previous day's price, updating with each ticker.
✨ It uses a dynamic approach that adjusts colors based on market movements, making it easier to detect trading opportunities.
👀 You will notice for a moment that some cells disappear; this is because the table updates with each ticker to show real-time changes.

Español:
🌟 Crypto Heatmap es una herramienta visual que permite una rápida y eficiente visualización del comportamiento de precios y cambios porcentuales de varias criptomonedas.
📊 Genera un mapa de calor para mostrar las variaciones en los precios de cierre diario, ayudando a los traders a identificar rápidamente los activos con mayor movimiento.
📈 Cálculo del cambio porcentual: Calcula la diferencia entre el precio actual y el del día anterior, actualizándose en cada ticker.
✨ Utiliza un enfoque dinámico que ajusta los colores según los movimientos del mercado, facilitando la detección de oportunidades de trading.
Aquí tienes la traducción al español:
👀 **Observarás por un momento que algunas celdas desaparecen; esto es porque la tabla se actualiza en cada ticker para mostrar el cambio en tiempo real.**
📊 It generates a heatmap to show variations in daily closing prices, helping traders quickly identify assets with the most movement.
📈 Percentage Change Calculation: It calculates the difference between the current price and the previous day's price, updating with each ticker.
✨ It uses a dynamic approach that adjusts colors based on market movements, making it easier to detect trading opportunities.
👀 You will notice for a moment that some cells disappear; this is because the table updates with each ticker to show real-time changes.
Español:
🌟 Crypto Heatmap es una herramienta visual que permite una rápida y eficiente visualización del comportamiento de precios y cambios porcentuales de varias criptomonedas.
📊 Genera un mapa de calor para mostrar las variaciones en los precios de cierre diario, ayudando a los traders a identificar rápidamente los activos con mayor movimiento.
📈 Cálculo del cambio porcentual: Calcula la diferencia entre el precio actual y el del día anterior, actualizándose en cada ticker.
✨ Utiliza un enfoque dinámico que ajusta los colores según los movimientos del mercado, facilitando la detección de oportunidades de trading.
Aquí tienes la traducción al español:
👀 **Observarás por un momento que algunas celdas desaparecen; esto es porque la tabla se actualiza en cada ticker para mostrar el cambio en tiempo real.**
オープンソーススクリプト
TradingViewの精神に則り、このスクリプトの作者はコードをオープンソースとして公開してくれました。トレーダーが内容を確認・検証できるようにという配慮です。作者に拍手を送りましょう!無料で利用できますが、コードの再公開はハウスルールに従う必要があります。
免責事項
この情報および投稿は、TradingViewが提供または推奨する金融、投資、トレード、その他のアドバイスや推奨を意図するものではなく、それらを構成するものでもありません。詳細は利用規約をご覧ください。
オープンソーススクリプト
TradingViewの精神に則り、このスクリプトの作者はコードをオープンソースとして公開してくれました。トレーダーが内容を確認・検証できるようにという配慮です。作者に拍手を送りましょう!無料で利用できますが、コードの再公開はハウスルールに従う必要があります。
免責事項
この情報および投稿は、TradingViewが提供または推奨する金融、投資、トレード、その他のアドバイスや推奨を意図するものではなく、それらを構成するものでもありません。詳細は利用規約をご覧ください。