OPEN-SOURCE SCRIPT
更新済 RSI Triple Time Frame

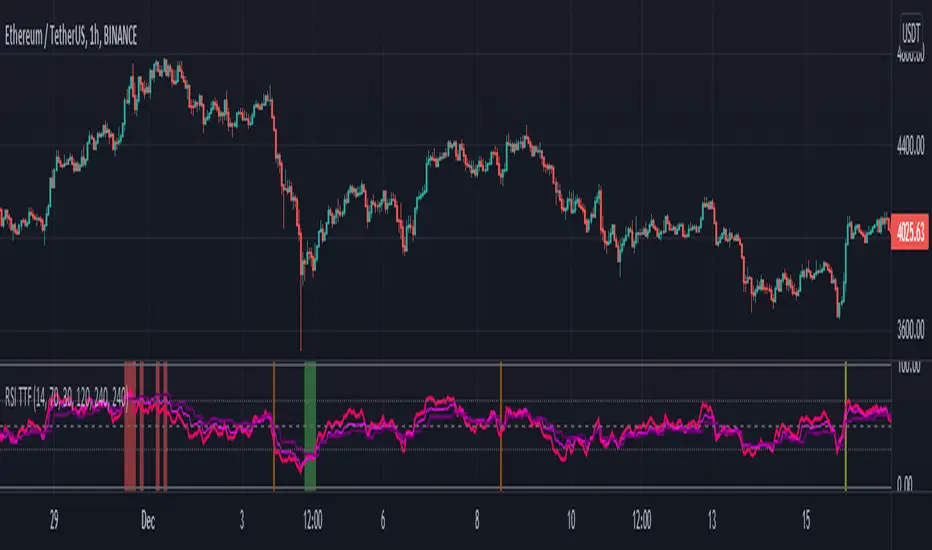
This indicator / study script can display the RSI for current chart timeframe along with the RSI of 1 to 3 other timeframes.
When all 3 additional RSI are at extreme levels (overbought/sold) or crossing the neutral line (50%) at the same moment, background chart color will change accordingly.
This indicates a strong momentum convergence between all selected timeframes, hence producing a stronger signal!
Go to settings to display/modify additional timeframes and/or to enable background colors:
Green = Overbought
Red = Oversold
Yellow = crossover neutral
Orange = crossunder neutral
NB1: For a simple and easy read of the RSI, set all additional TF to current chart TF and switch on desired colors.
NB2: Please note that current chart TF is not taken into consideration to change background color. But you can always set one of the 3 additional TF to the same TF as current chart.
Bonus: If you are also a user of my “MA Bollinger Bands + RSI” strategy script, this is particularly useful to visually detect crossover and crossunder of the RSI neutral line 😉
As always, enjoy!
リリースノート
Neutral Line, previsouly hard coded at 50, now has it's own user input.リリースノート
- [Upadted to Pine V5]
[Color changes between possible max & min values]
[Cleaner input settings]
リリースノート
- Upadted to Pine V5
- Color changes between possible max & min values
- Cleaner input settings
リリースノート
V5- Fixed the 3 "Higher Time Frame RSIs" repainting issues.
オープンソーススクリプト
TradingViewの精神に則り、このスクリプトの作者はコードをオープンソースとして公開してくれました。トレーダーが内容を確認・検証できるようにという配慮です。作者に拍手を送りましょう!無料で利用できますが、コードの再公開はハウスルールに従う必要があります。
免責事項
この情報および投稿は、TradingViewが提供または推奨する金融、投資、トレード、その他のアドバイスや推奨を意図するものではなく、それらを構成するものでもありません。詳細は利用規約をご覧ください。
オープンソーススクリプト
TradingViewの精神に則り、このスクリプトの作者はコードをオープンソースとして公開してくれました。トレーダーが内容を確認・検証できるようにという配慮です。作者に拍手を送りましょう!無料で利用できますが、コードの再公開はハウスルールに従う必要があります。
免責事項
この情報および投稿は、TradingViewが提供または推奨する金融、投資、トレード、その他のアドバイスや推奨を意図するものではなく、それらを構成するものでもありません。詳細は利用規約をご覧ください。