OPEN-SOURCE SCRIPT
更新済 United HUN City
Purpose and Usage
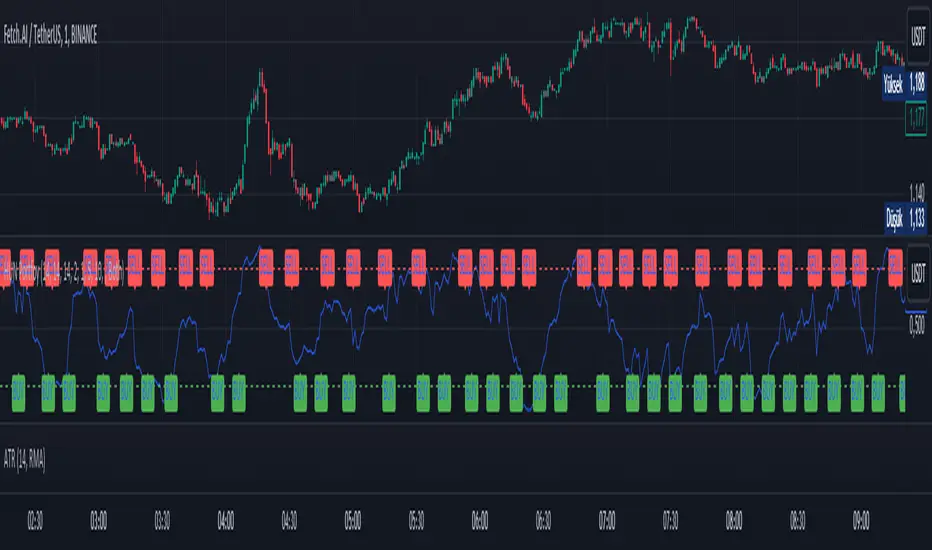
The purpose of this strategy is to create a composite indicator that combines the signals from the MFI, Fisher Transform, and Bollinger Bands %b indicators. By normalizing and averaging these indicators, the script aims to provide a smoother and more comprehensive signal that can be used to make trading decisions.
MFI (Money Flow Index): Measures buying and selling pressure based on price and volume.
Fisher Transform: Highlights potential reversal points by transforming price data to a Gaussian normal distribution.
Bollinger Bands %b: Indicates where the price is relative to the Bollinger Bands, helping to identify overbought or oversold conditions.
The combined indicator can be used to identify potential buy or sell signals based on the smoothed composite value. For instance, a high combined indicator value might indicate overbought conditions, while a low value might indicate oversold conditions.
リリースノート
Purpose and UsageThe purpose of this strategy is to create a composite indicator that combines the signals from the MFI, Fisher Transform, and Bollinger Bands %b indicators. By normalizing and averaging these indicators, the script aims to provide a smoother and more comprehensive signal that can be used to make trading decisions.
MFI (Money Flow Index): Measures buying and selling pressure based on price and volume.
Fisher Transform: Highlights potential reversal points by transforming price data to a Gaussian normal distribution.
Bollinger Bands %b: Indicates where the price is relative to the Bollinger Bands, helping to identify overbought or oversold conditions.
The combined indicator can be used to identify potential buy or sell signals based on the smoothed composite value. For instance, a high combined indicator value might indicate overbought conditions, while a low value might indicate oversold conditions.
2 saat önce
Sürüm Notları:
Purpose and Usage
The purpose of this strategy is to create a composite indicator that combines the signals from the MFI, Fisher Transform, and Bollinger Bands %b indicators. By normalizing and averaging these indicators, the script aims to provide a smoother and more comprehensive signal that can be used to make trading decisions.
MFI (Money Flow Index): Measures buying and selling pressure based on price and volume.
Fisher Transform: Highlights potential reversal points by transforming price data to a Gaussian normal distribution.
Bollinger Bands %b: Indicates where the price is relative to the Bollinger Bands, helping to identify overbought or oversold conditions.
The combined indicator can be used to identify potential buy or sell signals based on the smoothed composite value. For instance, a high combined indicator value might indicate overbought conditions, while a low value might indicate oversold conditions.
v2 Notes:
-Buy and Sell Signals Added:
Buy and sell signals are now integrated into the script.
-Band Levels Added:
Horizontal reference lines (bands) at specific levels are included.
-Minimum Number of Bars Between Buy and Sell Signals Added:
A user-defined input for the minimum number of bars between buy and sell signals is implemented.
-HUN Portfoy Percentage Change Added:
The percentage change calculation for the HUN Portfoy combined indicator is included.
リリースノート
Added timeframe change on the chart.リリースノート
V3 Updatesリリースノート
v3.1オープンソーススクリプト
TradingViewの精神に則り、このスクリプトの作者はコードをオープンソースとして公開してくれました。トレーダーが内容を確認・検証できるようにという配慮です。作者に拍手を送りましょう!無料で利用できますが、コードの再公開はハウスルールに従う必要があります。
免責事項
この情報および投稿は、TradingViewが提供または推奨する金融、投資、トレード、その他のアドバイスや推奨を意図するものではなく、それらを構成するものでもありません。詳細は利用規約をご覧ください。
オープンソーススクリプト
TradingViewの精神に則り、このスクリプトの作者はコードをオープンソースとして公開してくれました。トレーダーが内容を確認・検証できるようにという配慮です。作者に拍手を送りましょう!無料で利用できますが、コードの再公開はハウスルールに従う必要があります。
免責事項
この情報および投稿は、TradingViewが提供または推奨する金融、投資、トレード、その他のアドバイスや推奨を意図するものではなく、それらを構成するものでもありません。詳細は利用規約をご覧ください。