OPEN-SOURCE SCRIPT
Background Trend Follower by exp3rts

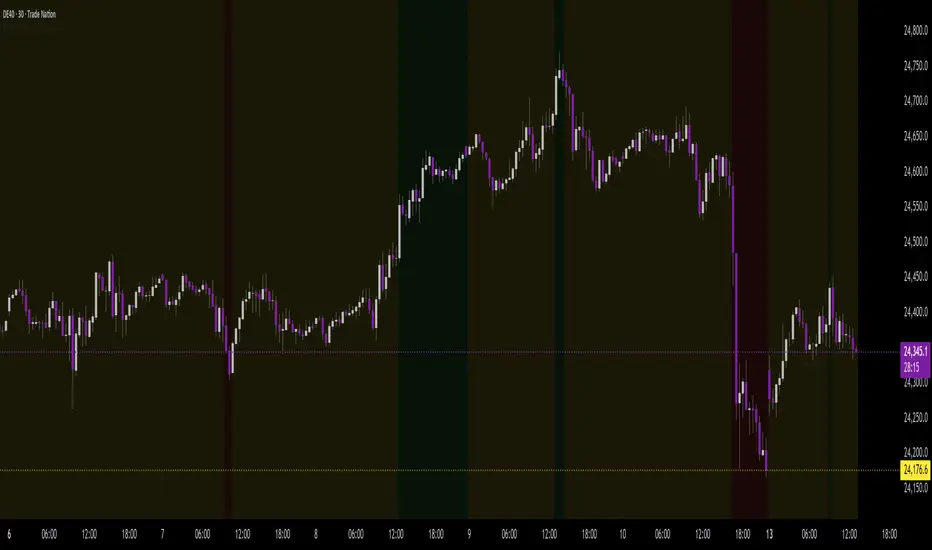
The Background Trend Follower indicator visually highlights the market’s daily directional bias using subtle background colors. It calculates the price change from the daily open and shades the chart background according to the current intraday momentum.
🟢 Green background → Price is significantly above the daily open (strong bullish trend)
🔴 Red background → Price is significantly below the daily open (strong bearish trend)
🟡 Yellow background → Price is trading near the daily open (neutral or consolidating phase)
Perfect for traders who want a quick visual sense of intraday bias — bullish, bearish, or neutral — without cluttering the chart with extra indicators.
🟢 Green background → Price is significantly above the daily open (strong bullish trend)
🔴 Red background → Price is significantly below the daily open (strong bearish trend)
🟡 Yellow background → Price is trading near the daily open (neutral or consolidating phase)
- The script automatically detects each new trading day.
- It records the opening price at the start of the day.
- As the session progresses, it continuously measures how far the current price has moved from that open.
- When the move exceeds ±50 points (custom threshold), the background color adapts to reflect the trend strength.
Perfect for traders who want a quick visual sense of intraday bias — bullish, bearish, or neutral — without cluttering the chart with extra indicators.
オープンソーススクリプト
TradingViewの精神に則り、このスクリプトの作者はコードをオープンソースとして公開してくれました。トレーダーが内容を確認・検証できるようにという配慮です。作者に拍手を送りましょう!無料で利用できますが、コードの再公開はハウスルールに従う必要があります。
免責事項
この情報および投稿は、TradingViewが提供または推奨する金融、投資、トレード、その他のアドバイスや推奨を意図するものではなく、それらを構成するものでもありません。詳細は利用規約をご覧ください。
オープンソーススクリプト
TradingViewの精神に則り、このスクリプトの作者はコードをオープンソースとして公開してくれました。トレーダーが内容を確認・検証できるようにという配慮です。作者に拍手を送りましょう!無料で利用できますが、コードの再公開はハウスルールに従う必要があります。
免責事項
この情報および投稿は、TradingViewが提供または推奨する金融、投資、トレード、その他のアドバイスや推奨を意図するものではなく、それらを構成するものでもありません。詳細は利用規約をご覧ください。