OPEN-SOURCE SCRIPT
Reversal off EMA
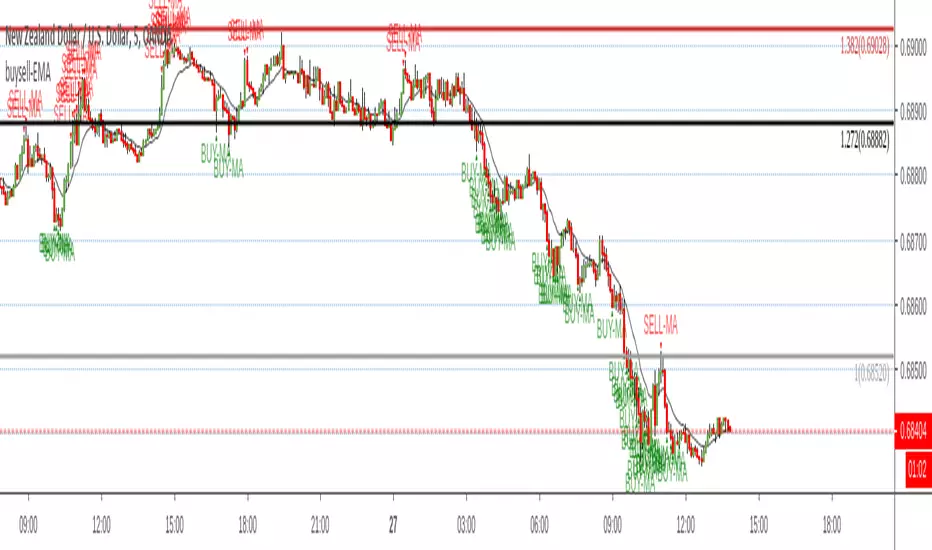
Simple script find when a probable reversal will start. When price moves sharply away from the 13 EMA a BUY/SELL signal will pop up. Scripted to work on 5m 1h, 4h, and daily chart. But it doesn't work on all charts. Not sure why. I'm a forex trader and use this on NZDUSD. It doesn't give too good results on the JPY charts. I think its a fairly good reversal indicator. It definitely doesn't catch them all, and if there is a strong bearish or bullish impulse it doesn't work too well. But with all indicators, you need other conformations when to get in and when to get out. Hope it helps someone.
オープンソーススクリプト
TradingViewの精神に則り、このスクリプトの作者はコードをオープンソースとして公開してくれました。トレーダーが内容を確認・検証できるようにという配慮です。作者に拍手を送りましょう!無料で利用できますが、コードの再公開はハウスルールに従う必要があります。
免責事項
この情報および投稿は、TradingViewが提供または推奨する金融、投資、トレード、その他のアドバイスや推奨を意図するものではなく、それらを構成するものでもありません。詳細は利用規約をご覧ください。
オープンソーススクリプト
TradingViewの精神に則り、このスクリプトの作者はコードをオープンソースとして公開してくれました。トレーダーが内容を確認・検証できるようにという配慮です。作者に拍手を送りましょう!無料で利用できますが、コードの再公開はハウスルールに従う必要があります。
免責事項
この情報および投稿は、TradingViewが提供または推奨する金融、投資、トレード、その他のアドバイスや推奨を意図するものではなく、それらを構成するものでもありません。詳細は利用規約をご覧ください。