OPEN-SOURCE SCRIPT
FIB Band Signals with RSI Filter
Original Author: Rashad
Added by Rashad 6-26-16
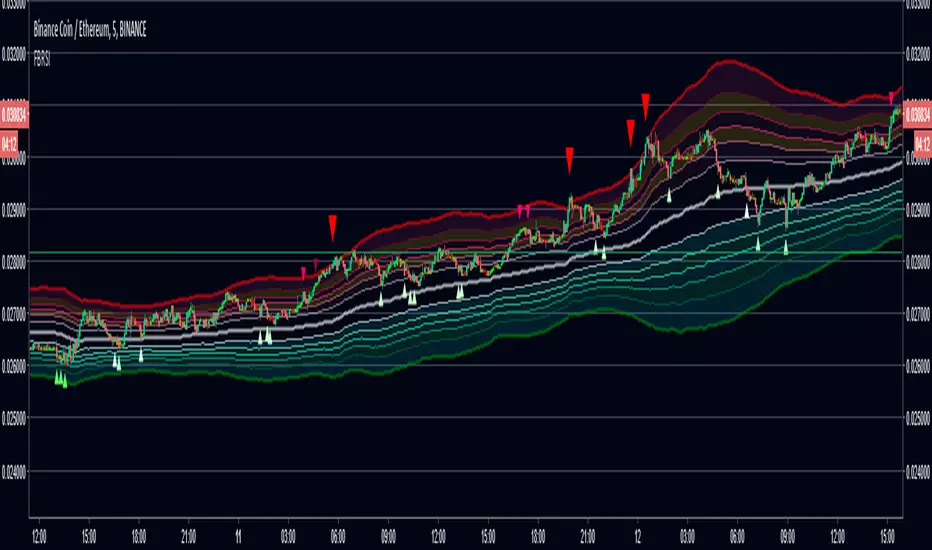
These Bollinger bands feature Fibonacci retracements to very clearly show areas of support and resistance . The basis is calculate off of the Volume Weighted Moving Average . The Bands are 3 standard deviations away from the mean. 99.73% of observations should be in this range.
Updated by Dysrupt 7-12-18
-Buy signals added on lower bands, mean and upper 3 bands
-Sell signals added to upper 3 bands
-RSI filter applied to signals
-Alerts not yet added
-Long Biased
NOTE: This is NOT a set and forget signal indicator. It is extremely versatile for all environments by adjusting the RSI filter and checking the band signals needed for the current trend and trading style.
Added by Rashad 6-26-16
These Bollinger bands feature Fibonacci retracements to very clearly show areas of support and resistance . The basis is calculate off of the Volume Weighted Moving Average . The Bands are 3 standard deviations away from the mean. 99.73% of observations should be in this range.
Updated by Dysrupt 7-12-18
-Buy signals added on lower bands, mean and upper 3 bands
-Sell signals added to upper 3 bands
-RSI filter applied to signals
-Alerts not yet added
-Long Biased
NOTE: This is NOT a set and forget signal indicator. It is extremely versatile for all environments by adjusting the RSI filter and checking the band signals needed for the current trend and trading style.
オープンソーススクリプト
TradingViewの精神に則り、このスクリプトの作者はコードをオープンソースとして公開してくれました。トレーダーが内容を確認・検証できるようにという配慮です。作者に拍手を送りましょう!無料で利用できますが、コードの再公開はハウスルールに従う必要があります。
免責事項
この情報および投稿は、TradingViewが提供または推奨する金融、投資、トレード、その他のアドバイスや推奨を意図するものではなく、それらを構成するものでもありません。詳細は利用規約をご覧ください。
オープンソーススクリプト
TradingViewの精神に則り、このスクリプトの作者はコードをオープンソースとして公開してくれました。トレーダーが内容を確認・検証できるようにという配慮です。作者に拍手を送りましょう!無料で利用できますが、コードの再公開はハウスルールに従う必要があります。
免責事項
この情報および投稿は、TradingViewが提供または推奨する金融、投資、トレード、その他のアドバイスや推奨を意図するものではなく、それらを構成するものでもありません。詳細は利用規約をご覧ください。