OPEN-SOURCE SCRIPT
Morning & Evening Star
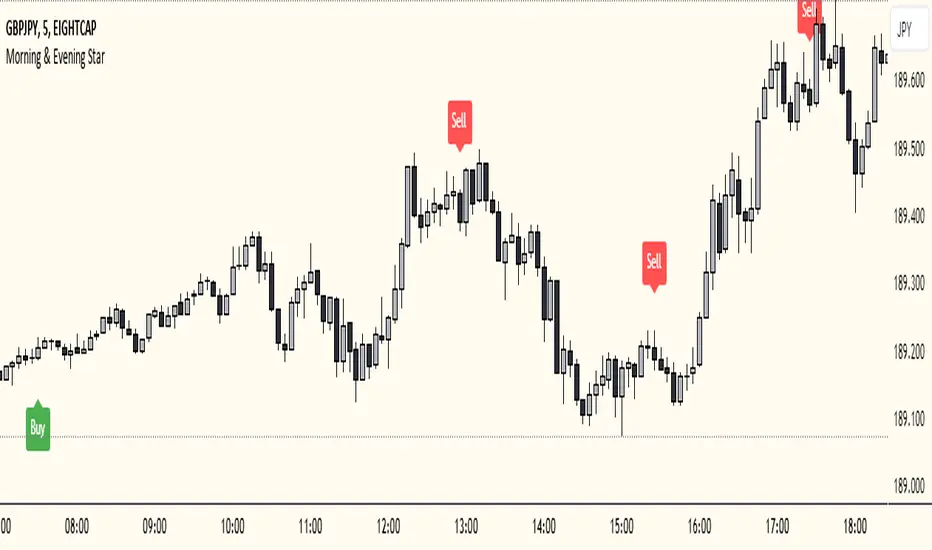
This Pine Script code is designed to identify Morning Star and Evening Star candlestick patterns on a chart. Here's how it works:
Calculate Candle Body and Wick Sizes: The script calculates the size of the candle body and wick based on the difference between the close and open prices, as well as the difference between the high and the maximum of the close and open prices.
Determine if the Candle is a Doji: It checks if the candle is a doji by comparing the size of the body to a fraction of the wick size. If the body size is less than or equal to 20% of the wick size, it is considered a doji.
Determine if the Current Candle is Bullish or Bearish: It checks if the current candle is bullish (close price is higher than open price) or bearish (close price is lower than open price).
Plot Shapes for Doji and Candles: It plots shapes on the chart to indicate buy and sell signals based on the presence of a doji and the formation of Morning Star or Evening Star patterns. These shapes are displayed below (for buy signals) or above (for sell signals) the respective candlesticks.
Combine this indicator with my support and resistance zones indicator for better results
オープンソーススクリプト
TradingViewの精神に則り、このスクリプトの作者はコードをオープンソースとして公開してくれました。トレーダーが内容を確認・検証できるようにという配慮です。作者に拍手を送りましょう!無料で利用できますが、コードの再公開はハウスルールに従う必要があります。
免責事項
この情報および投稿は、TradingViewが提供または推奨する金融、投資、トレード、その他のアドバイスや推奨を意図するものではなく、それらを構成するものでもありません。詳細は利用規約をご覧ください。
オープンソーススクリプト
TradingViewの精神に則り、このスクリプトの作者はコードをオープンソースとして公開してくれました。トレーダーが内容を確認・検証できるようにという配慮です。作者に拍手を送りましょう!無料で利用できますが、コードの再公開はハウスルールに従う必要があります。
免責事項
この情報および投稿は、TradingViewが提供または推奨する金融、投資、トレード、その他のアドバイスや推奨を意図するものではなく、それらを構成するものでもありません。詳細は利用規約をご覧ください。