OPEN-SOURCE SCRIPT
更新済 David_FairPriceCandlestick_calculated
Description:
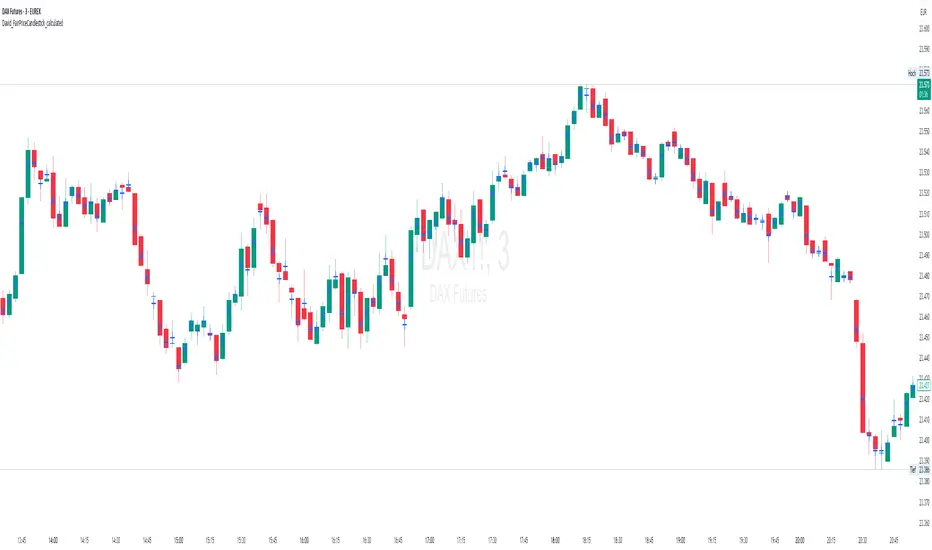
This indicator displays the "Typical Price" for each candle as a visual marker (cross) directly on the chart. The Typical Price is calculated as the average of the High, Low, and Close values of each bar:
(High + Low + Close) / 3
The marker provides a quick visual reference to the fair or average price level within every single candle.
Unlike a Point of Control (POC) or volume-based indicators, this script works purely with price data and is independent of volume or order flow.
Use cases:
Identify where most trading activity may have been concentrated within the candle (for price-based strategies)
Support as a reference line for mean-reversion or fair value concepts
Works on all timeframes and instruments
Customization:
You can easily change the marker style (cross, dot, triangle, etc.) and color within the script.
リリースノート
Description:This indicator displays the "Typical Price" for each candle as a visual marker (cross) directly on the chart. The Typical Price is calculated as the average of the High, Low, and Close values of each bar:
(High + Low + Close) / 3
The marker provides a quick visual reference to the fair or average price level within every single candle.
Unlike a Point of Control (POC) or volume-based indicators, this script works purely with price data and is independent of volume or order flow.
Use cases:
Identify where most trading activity may have been concentrated within the candle (for price-based strategies)
Support as a reference line for mean-reversion or fair value concepts
Works on all timeframes and instruments
Customization:
You can easily change the marker style (cross, dot, triangle, etc.) and color within the script.
オープンソーススクリプト
TradingViewの精神に則り、このスクリプトの作者はコードをオープンソースとして公開してくれました。トレーダーが内容を確認・検証できるようにという配慮です。作者に拍手を送りましょう!無料で利用できますが、コードの再公開はハウスルールに従う必要があります。
免責事項
この情報および投稿は、TradingViewが提供または推奨する金融、投資、トレード、その他のアドバイスや推奨を意図するものではなく、それらを構成するものでもありません。詳細は利用規約をご覧ください。
オープンソーススクリプト
TradingViewの精神に則り、このスクリプトの作者はコードをオープンソースとして公開してくれました。トレーダーが内容を確認・検証できるようにという配慮です。作者に拍手を送りましょう!無料で利用できますが、コードの再公開はハウスルールに従う必要があります。
免責事項
この情報および投稿は、TradingViewが提供または推奨する金融、投資、トレード、その他のアドバイスや推奨を意図するものではなく、それらを構成するものでもありません。詳細は利用規約をご覧ください。