OPEN-SOURCE SCRIPT
更新済 NYSE extended session background
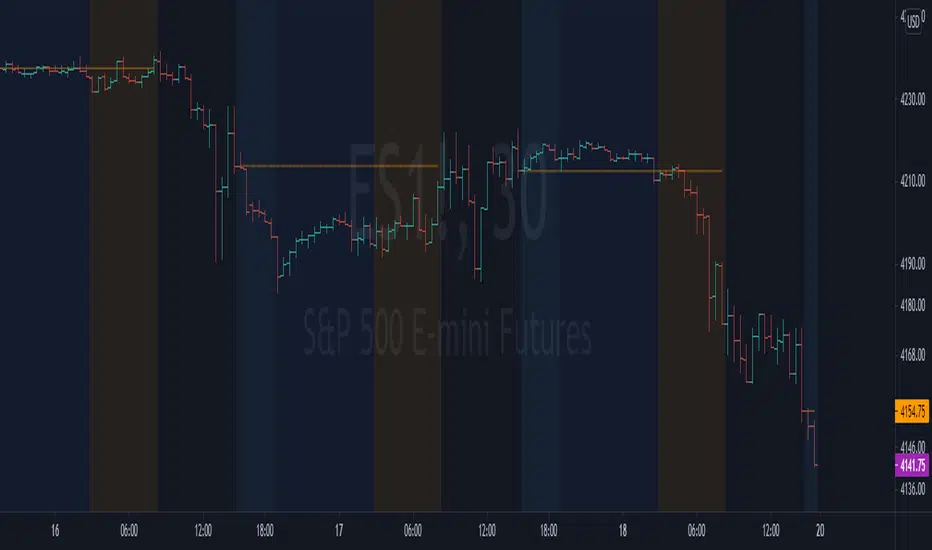
This script adds background to the chart to highlight different time areas in any chart.
The time areas are in relation to the open/close time of NYSE , both regular and extended session.
The background colors are the following by default:
In addition, previous day close price line is shown during extended and closed sessions (orange line).
This script is useful to visualize any chart in relation to the NYSE timetable.
The time areas are in relation to the open/close time of NYSE , both regular and extended session.
The background colors are the following by default:
- NO COLOR : NYSE is open
- DARK BLUE : NYSE is closed
- LIGHT BLUE : NYSE post market session
- ORANGE : NYSE pre market session
In addition, previous day close price line is shown during extended and closed sessions (orange line).
This script is useful to visualize any chart in relation to the NYSE timetable.
リリースノート
bug that caused wrong background timingリリースノート
Chart updateオープンソーススクリプト
TradingViewの精神に則り、このスクリプトの作者はコードをオープンソースとして公開してくれました。トレーダーが内容を確認・検証できるようにという配慮です。作者に拍手を送りましょう!無料で利用できますが、コードの再公開はハウスルールに従う必要があります。
免責事項
この情報および投稿は、TradingViewが提供または推奨する金融、投資、トレード、その他のアドバイスや推奨を意図するものではなく、それらを構成するものでもありません。詳細は利用規約をご覧ください。
オープンソーススクリプト
TradingViewの精神に則り、このスクリプトの作者はコードをオープンソースとして公開してくれました。トレーダーが内容を確認・検証できるようにという配慮です。作者に拍手を送りましょう!無料で利用できますが、コードの再公開はハウスルールに従う必要があります。
免責事項
この情報および投稿は、TradingViewが提供または推奨する金融、投資、トレード、その他のアドバイスや推奨を意図するものではなく、それらを構成するものでもありません。詳細は利用規約をご覧ください。