OPEN-SOURCE SCRIPT
更新済 Diagonal Support and Resistance Trend Lines
A simple indicator to plot trend lines.
1. Adjust the "Pivot Lookback" (default: 20) to control pivot sensitivity. Larger values detect more significant pivots.
2. Adjust the "Max Trend Lines" (default: 4) to control how many support/resistance lines are drawn.
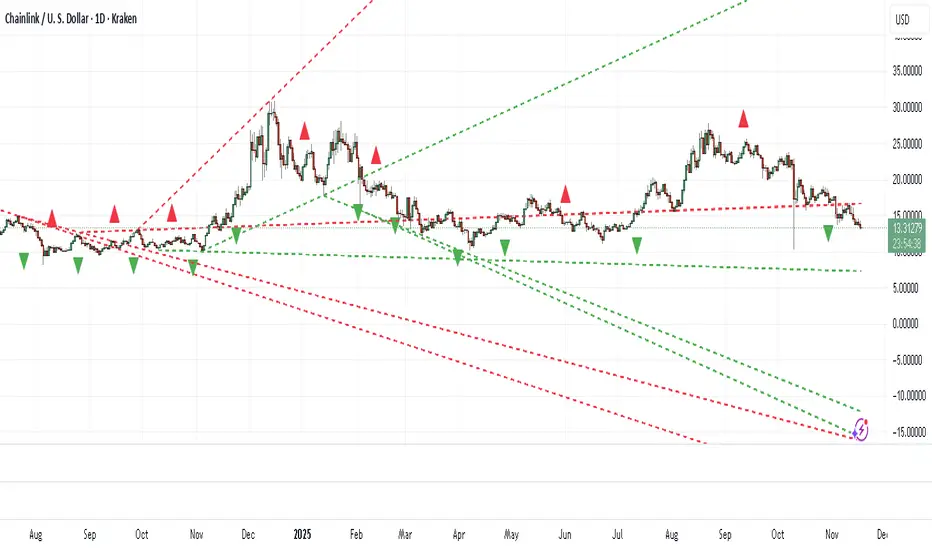
The indicator will plot:
1. Red dashed lines for resistance (based on pivot highs).
2. Green dashed lines for support (based on pivot lows).
3. Small red triangles above bars for pivot highs and green triangles below bars for pivot lows.
1. Adjust the "Pivot Lookback" (default: 20) to control pivot sensitivity. Larger values detect more significant pivots.
2. Adjust the "Max Trend Lines" (default: 4) to control how many support/resistance lines are drawn.
The indicator will plot:
1. Red dashed lines for resistance (based on pivot highs).
2. Green dashed lines for support (based on pivot lows).
3. Small red triangles above bars for pivot highs and green triangles below bars for pivot lows.
リリースノート
Updated to v6 and added option to display dotted, dash, or solid lines.リリースノート
Editリリースノート
You can now set the thickness of trend line.オープンソーススクリプト
TradingViewの精神に則り、このスクリプトの作者はコードをオープンソースとして公開してくれました。トレーダーが内容を確認・検証できるようにという配慮です。作者に拍手を送りましょう!無料で利用できますが、コードの再公開はハウスルールに従う必要があります。
免責事項
この情報および投稿は、TradingViewが提供または推奨する金融、投資、トレード、その他のアドバイスや推奨を意図するものではなく、それらを構成するものでもありません。詳細は利用規約をご覧ください。
オープンソーススクリプト
TradingViewの精神に則り、このスクリプトの作者はコードをオープンソースとして公開してくれました。トレーダーが内容を確認・検証できるようにという配慮です。作者に拍手を送りましょう!無料で利用できますが、コードの再公開はハウスルールに従う必要があります。
免責事項
この情報および投稿は、TradingViewが提供または推奨する金融、投資、トレード、その他のアドバイスや推奨を意図するものではなく、それらを構成するものでもありません。詳細は利用規約をご覧ください。