OPEN-SOURCE SCRIPT
EMA Offset Strategy with RSI
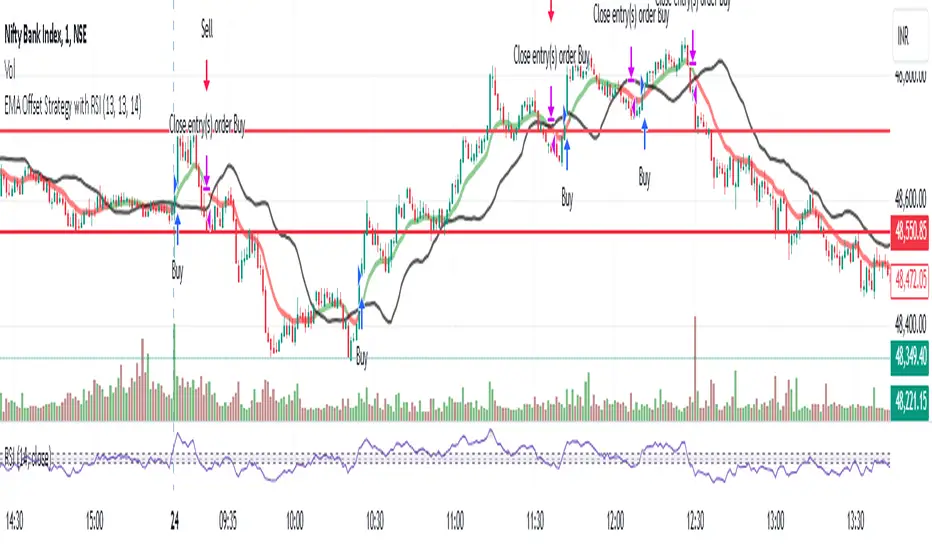
This strategy combines the power of exponential moving averages (EMA) and the Relative Strength Index (RSI) to identify potential buy and sell signals in the market.
Ideal Use Cases:
Suitable for trending markets to ride momentum while filtering out false signals with RSI confirmation.
Can be used for swing trading or intraday trading on various timeframes.
Customizations:
Users can adjust the EMA period, offset period, and RSI period from the settings to fit their preferred trading style and market conditions.
Visualization:
EMA (Blue): Traditional moving average line.
Offset EMA (Red): Predictive forward offset line.
Buy/Sell Signals: Clearly marked on the chart for actionable insights.
オープンソーススクリプト
TradingViewの精神に則り、この作者はスクリプトのソースコードを公開しているので、その内容を理解し検証することができます。作者に感謝です!無料でお使いいただけますが、このコードを投稿に再利用する際にはハウスルールに従うものとします。
免責事項
これらの情報および投稿は、TradingViewが提供または保証する金融、投資、取引、またはその他の種類のアドバイスや推奨を意図したものではなく、またそのようなものでもありません。詳しくは利用規約をご覧ください。
オープンソーススクリプト
TradingViewの精神に則り、この作者はスクリプトのソースコードを公開しているので、その内容を理解し検証することができます。作者に感謝です!無料でお使いいただけますが、このコードを投稿に再利用する際にはハウスルールに従うものとします。
免責事項
これらの情報および投稿は、TradingViewが提供または保証する金融、投資、取引、またはその他の種類のアドバイスや推奨を意図したものではなく、またそのようなものでもありません。詳しくは利用規約をご覧ください。