OPEN-SOURCE SCRIPT
Position Sizer by Volatility
Description:
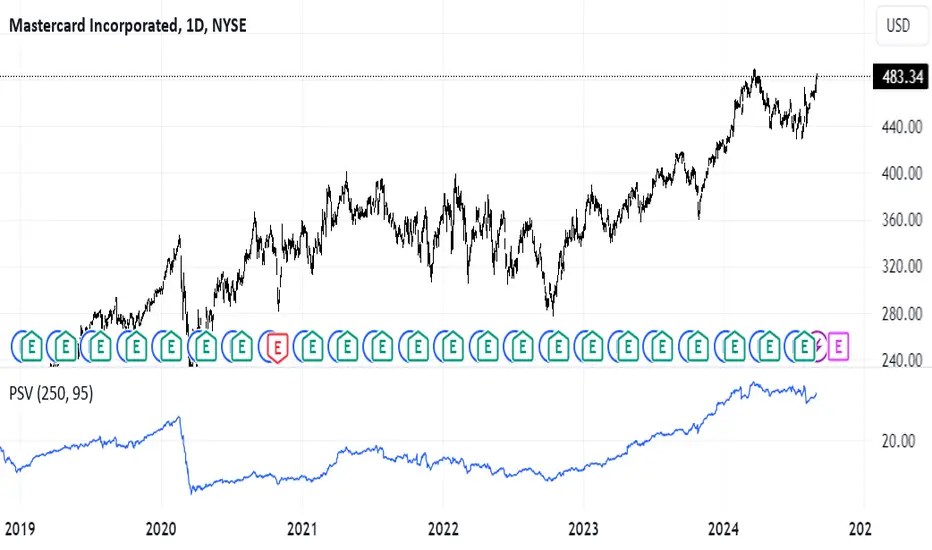
The **Position Sizer by Volatility (PSV)** is an indicator that helps traders determine what percentage of their deposit a position will occupy, taking into account the current market volatility. PSV calculates the range of price movements over recent periods and shows how large this movement is compared to historical data. The lower the value, the lower the volatility, and the smaller the stop-loss required relative to the current price.
Explanation of PSV Parameters:
- `len` (Period Length):** This parameter sets the number of candles (bars) on the chart that will be used to calculate volatility. For example, if `len` is set to 250, the indicator will analyze price movements over the last 250 bars. The larger the value, the longer the period used for volatility assessment.
- `percent` (Percentile):** This parameter determines how strong price fluctuations you want to account for. For instance, if you set `percent` to 95, the indicator will focus on the 5% of instances where the price range was the largest over the specified period. This helps evaluate volatility during periods of sharp price movements, which may require a larger stop-loss. A higher percentile accounts for rarer but stronger movements, and vice versa.
オープンソーススクリプト
TradingViewの精神に則り、このスクリプトの作者はコードをオープンソースとして公開してくれました。トレーダーが内容を確認・検証できるようにという配慮です。作者に拍手を送りましょう!無料で利用できますが、コードの再公開はハウスルールに従う必要があります。
免責事項
この情報および投稿は、TradingViewが提供または推奨する金融、投資、トレード、その他のアドバイスや推奨を意図するものではなく、それらを構成するものでもありません。詳細は利用規約をご覧ください。
オープンソーススクリプト
TradingViewの精神に則り、このスクリプトの作者はコードをオープンソースとして公開してくれました。トレーダーが内容を確認・検証できるようにという配慮です。作者に拍手を送りましょう!無料で利用できますが、コードの再公開はハウスルールに従う必要があります。
免責事項
この情報および投稿は、TradingViewが提供または推奨する金融、投資、トレード、その他のアドバイスや推奨を意図するものではなく、それらを構成するものでもありません。詳細は利用規約をご覧ください。