OPEN-SOURCE SCRIPT
更新済 PEV Price Band
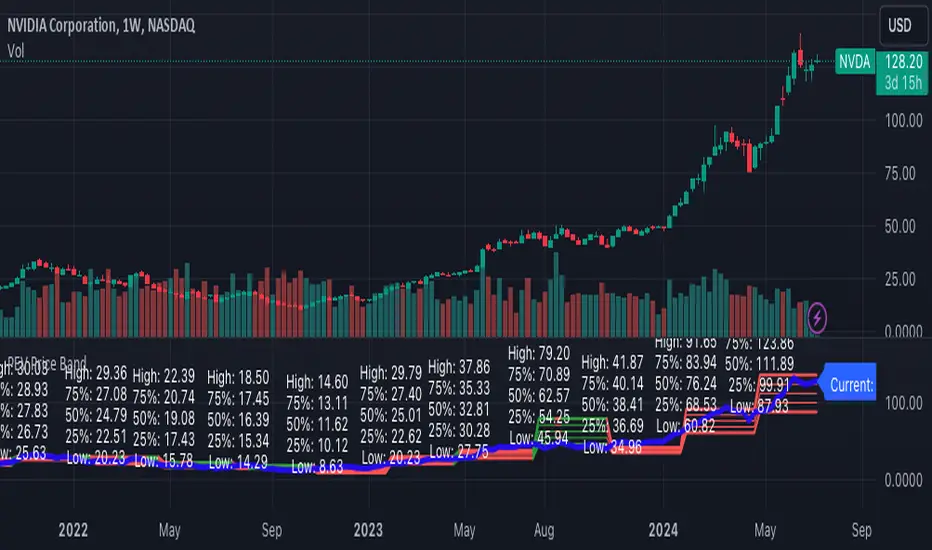
The PEV Price Band shows prices calculated using the high and low P/FQ EV of the previous period. (price to enterprise value per share for the last quarter) multiplied by FQ's current EVPS (similar to comparing marketcap to enterprise value but edit equations that are close to the theory of P/E)
If the current price is lower than the minimum P/EVPS, it is considered cheap. In other words, a current price is above the maximum is considered expensive.
PEV Price Band consists of 2 parts.
- First of all, the current P/EVPS value is "green" (if the markecap is less than the enterprise value) or "red" (if the marketcap is more than the enterprise value) or "gold" (if the market value is less than the enterprise value and less than equity)
- Second, the blue line is the closing price.
リリースノート
1. Fixed bug in 5000 bars in day timeframe- Added attribute "calc_bars_count = 5000" in indicator
2. Changed "TOTAL_SHARES_OUTSTANDING" to "DILUTED_SHARES_OUTSTANDING"
3. Changed condition from checking uptrend condition to current price less than enterprise value for easy understanding
オープンソーススクリプト
TradingViewの精神に則り、このスクリプトの作者はコードをオープンソースとして公開してくれました。トレーダーが内容を確認・検証できるようにという配慮です。作者に拍手を送りましょう!無料で利用できますが、コードの再公開はハウスルールに従う必要があります。
免責事項
この情報および投稿は、TradingViewが提供または推奨する金融、投資、トレード、その他のアドバイスや推奨を意図するものではなく、それらを構成するものでもありません。詳細は利用規約をご覧ください。
オープンソーススクリプト
TradingViewの精神に則り、このスクリプトの作者はコードをオープンソースとして公開してくれました。トレーダーが内容を確認・検証できるようにという配慮です。作者に拍手を送りましょう!無料で利用できますが、コードの再公開はハウスルールに従う必要があります。
免責事項
この情報および投稿は、TradingViewが提供または推奨する金融、投資、トレード、その他のアドバイスや推奨を意図するものではなく、それらを構成するものでもありません。詳細は利用規約をご覧ください。