OPEN-SOURCE SCRIPT
更新済 Session Shading (Asia, London, NY) — EST
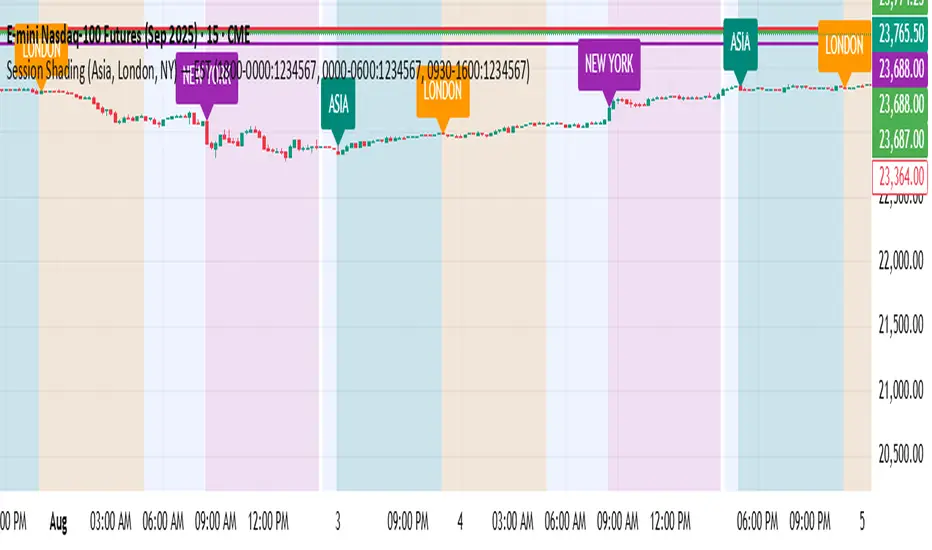
This indicator highlights the three major trading sessions — Asia, London, and New York — on your chart in Eastern Time. Each session is shaded a different color, with optional labels marking when each begins. It’s designed to help traders quickly see when global market centers are active, identify overlaps between sessions, and align entries or exits with periods of higher liquidity and volatility.
リリースノート
This indicator highlights the three major trading sessions — Asia, London, and New York — on your chart in Eastern Time. Each session is shaded a different color, with optional labels marking when each begins. It’s designed to help traders quickly see when global market centers are active, identify overlaps between sessions, and align entries or exits with periods of higher liquidity and volatility.リリースノート
This indicator highlights the three major trading sessions — Asia, London, and New York — on your chart in any time zone. Each session is shaded a different color, with optional labels marking when each begins. It’s designed to help traders quickly see when global market centers are active, identify overlaps between sessions, and align entries or exits with periods of higher liquidity and volatility.オープンソーススクリプト
TradingViewの精神に則り、このスクリプトの作者はコードをオープンソースとして公開してくれました。トレーダーが内容を確認・検証できるようにという配慮です。作者に拍手を送りましょう!無料で利用できますが、コードの再公開はハウスルールに従う必要があります。
免責事項
この情報および投稿は、TradingViewが提供または推奨する金融、投資、トレード、その他のアドバイスや推奨を意図するものではなく、それらを構成するものでもありません。詳細は利用規約をご覧ください。
オープンソーススクリプト
TradingViewの精神に則り、このスクリプトの作者はコードをオープンソースとして公開してくれました。トレーダーが内容を確認・検証できるようにという配慮です。作者に拍手を送りましょう!無料で利用できますが、コードの再公開はハウスルールに従う必要があります。
免責事項
この情報および投稿は、TradingViewが提供または推奨する金融、投資、トレード、その他のアドバイスや推奨を意図するものではなく、それらを構成するものでもありません。詳細は利用規約をご覧ください。