OPEN-SOURCE SCRIPT
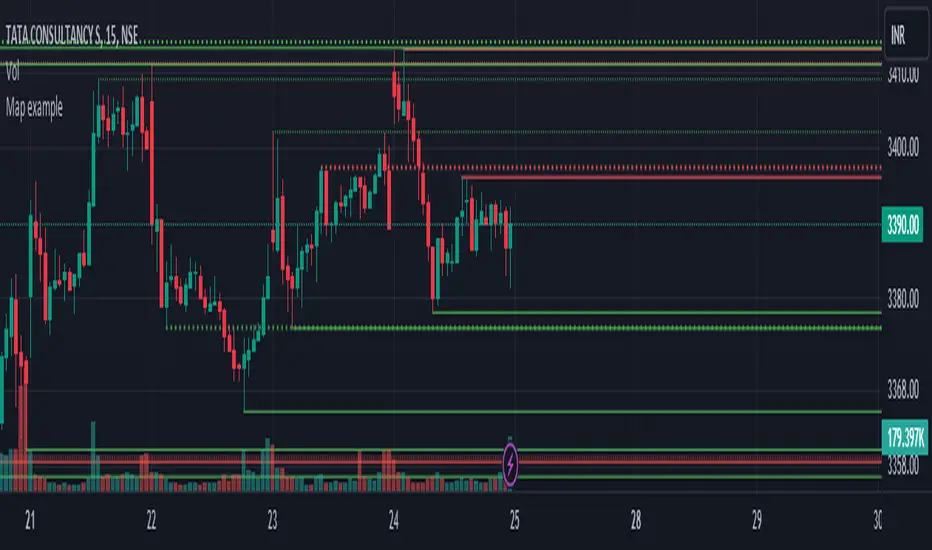
Map example
Using Maps collections:
This code manipulates support and resistance lines using maps collection.
We normally maintain array/udt of lines and related properties to segregate lines as support and or resistance.
With introduction of maps the same can be achieved without creating lines array/udt.
What does this code do:
1. Plot support and resistance lines based on ta.pivothigh() and ta.pivotlow()
2. When price crosses support line, the line is marked as resistance and color is changed to resistance line color and style is changed to dotted line (support turned resistance). Also the width of the line is set based on number of crosses. Finally the support/resistance line is removed when number of times price crossing the line reaches max allowed crosses (input parameter)
Where maps are used:
1. map_sr_cross - Number of times the support/resistance lines has been crossed by price
2. map_sr_type - R=resistance, S=support
3. color_map - color for support and resistance lines
4. style_map - line styles. Support/resistance lines as solid style and support turned resistance/resistance turned support lines as dotted style.
オープンソーススクリプト
TradingViewの精神に則り、このスクリプトの作者はコードをオープンソースとして公開してくれました。トレーダーが内容を確認・検証できるようにという配慮です。作者に拍手を送りましょう!無料で利用できますが、コードの再公開はハウスルールに従う必要があります。
免責事項
この情報および投稿は、TradingViewが提供または推奨する金融、投資、トレード、その他のアドバイスや推奨を意図するものではなく、それらを構成するものでもありません。詳細は利用規約をご覧ください。
オープンソーススクリプト
TradingViewの精神に則り、このスクリプトの作者はコードをオープンソースとして公開してくれました。トレーダーが内容を確認・検証できるようにという配慮です。作者に拍手を送りましょう!無料で利用できますが、コードの再公開はハウスルールに従う必要があります。
免責事項
この情報および投稿は、TradingViewが提供または推奨する金融、投資、トレード、その他のアドバイスや推奨を意図するものではなく、それらを構成するものでもありません。詳細は利用規約をご覧ください。